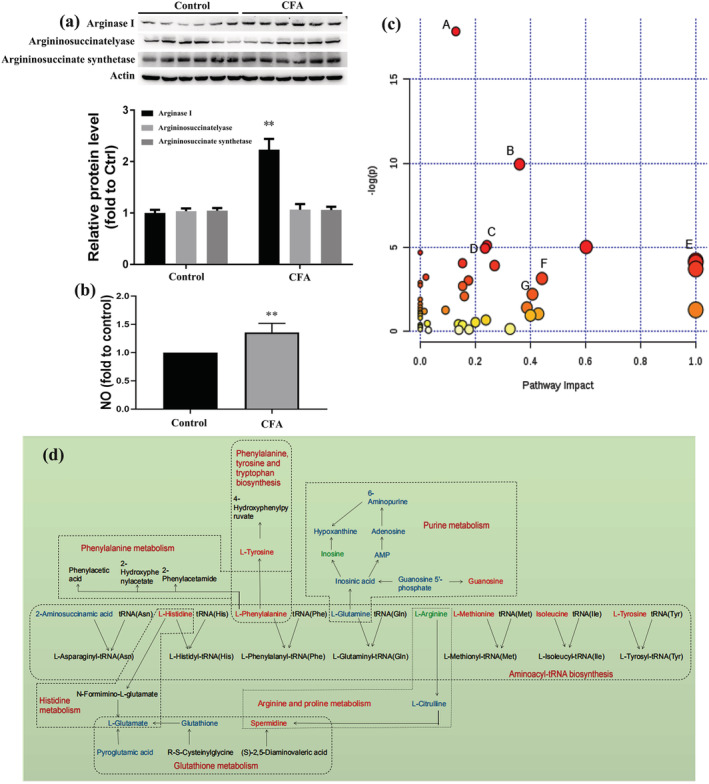
FIGURE 3.

Pathway analysis of the different metabolites: (a) Western Blot (WB) assay for key protein expression; (b) NO level detection; and (c) bubble plot for pathway analysis of the different metabolites. The x‐axis represents the pathway impact and the y‐axis describes the impact value. The circular area is proportional to the number of metabolites assigned to the term and the color accords with the P‐value; (d) the regulatory relationship of metabolic pathways in response to CFA‐induced inflammatory pain. Potential biomarkers are marked as red (up‐regulated), green (down‐regulated) and blue (without significant changes). Other undetected metabolites in the metabolic pathway are labeled in black. The names of related metabolic pathways are marked in red in the corresponding dashed box
