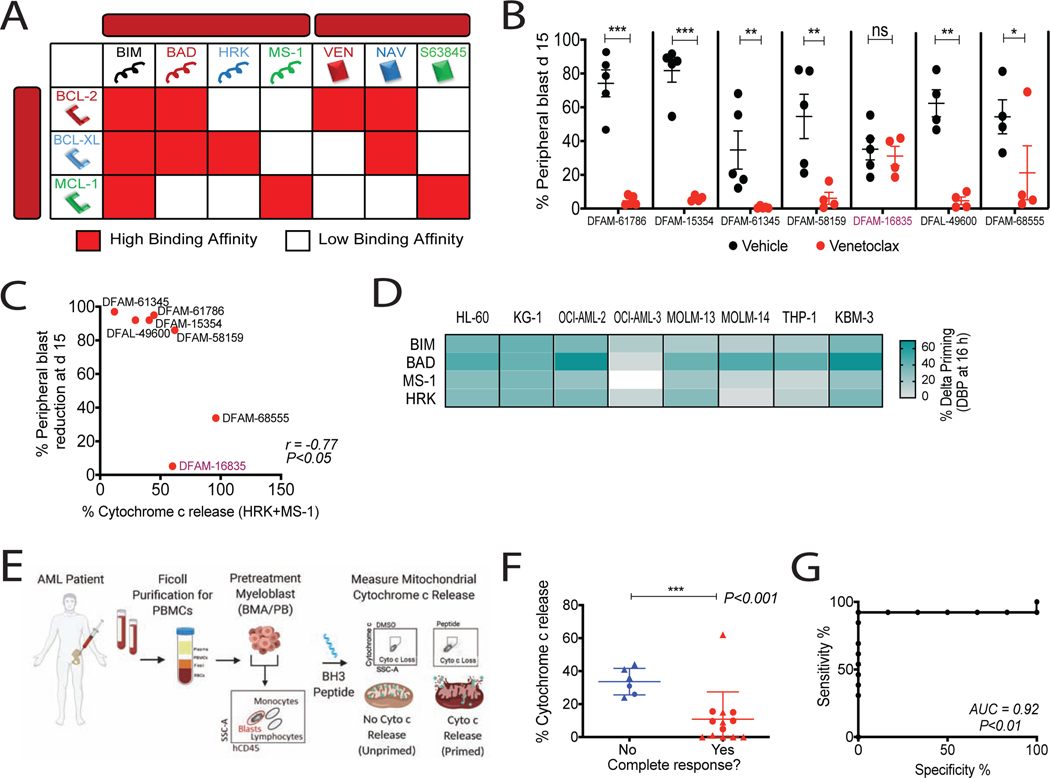
Figure 1: Baseline BH3 profiling predicts clinical response to venetoclax and hypomethylating agent combination.
(A) Interaction map for BH3 peptides and BH3 mimetics with BCL-2 family proteins. Red, Kd < 100nM, determined by fluorescence polarization. Ven, venetoclax; Nav, navitoclax. (B) % hCD45+ circulating blasts in AML PDXs on venetoclax treatment (100 mg/kg, PO, 5 days/week) for 2 weeks. Mean ± SEM, n=5 mice; *P<0.05, **P<0.01, ***P<0.001, two-tailed Student’s t-test.
(C) Spearman correlation between cytochrome c release caused by HRK+MS-1 peptides in pretreatment PDX myeloblasts and blast reduction at day 15 post therapy.
(D) Heatmap of delta priming responses to indicated peptides in AML cell lines at 16h azacytidine treatment. Delta priming = % cytochrome c lossdrug - % cytochrome c lossDMSO (n=3 replicates). (E) Schematic of BH3 profiling of AML patient myeloblasts.
(F) Cytochrome c release derived from BH3 profiling using HRK+MS-1 peptides in pretreatment myeloblasts compared with response status of patients treated with venetoclax plus HMA. Circles, phase 1b (NCT02203773) clinical trial patients (n=7); triangles, off-trial patients (n=12); horizontal line, median with interquartile range; ***P<0.001, one-tailed Wilcoxon-rank sum test.
(G) Receiver operative characteristic (ROC) curve of HRK+MS-1-induced cytochrome c release versus clinical response.

