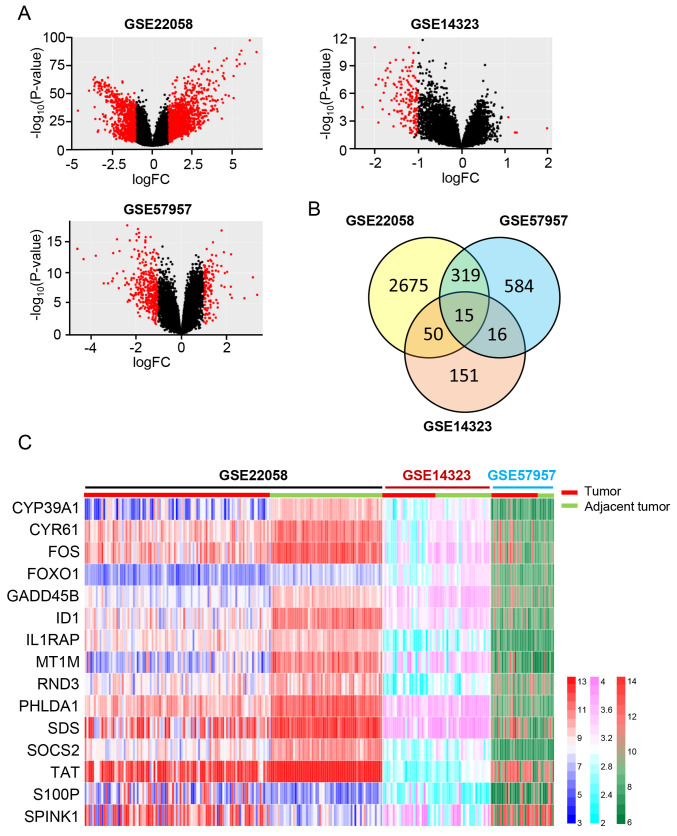
Figure 1.
Identification of DEGs. (A) Volcano plots of the GSE22058, GSE14323 and GSE57957 datasets. Red dots represent DEGs with |logFC| >1 and P<0.05, black dots represent genes without significant changes. (B) Venn diagrams of overlapping DEGs between the GSE22058, GSE14323 and GSE57957 datasets. (C) A heat map of overlapping DEGs. Each column represents a sample, and each row represents one gene. The gradient color represents the gene expression value. DEGs, differentially expressed genes; FC, fold change.

