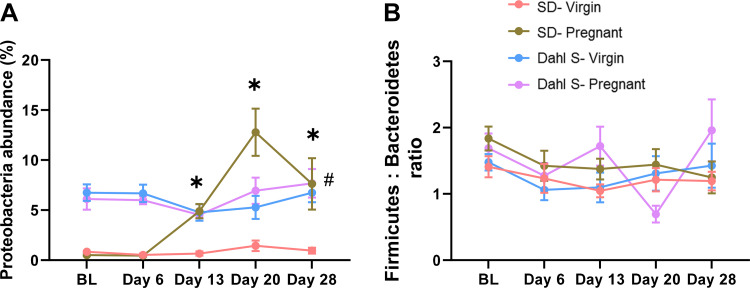
Figure 2.
Dahl S rats display dysbiosis. A: percent Proteobacteria phylum abundance. B: Firmicutes to Bacteroidetes ratio. The pink line represents virgin SD; the green line represents the pregnant SD; the blue line represents virgin Dahl S; and the purple line represents the pregnant Dahl S. BL: baseline; day 6: gestation day 6 (early); day 13: gestation day 13 (middle); day 20: gestation day 20 (late); and day 28: day 28 (1 wk postpartum). Data are expressed as means ± SE. *P < 0.05 vs. matched SD virgin. #P < 0.05 Dahl S (virgin and pregnant groups) vs. SD virgin. n = 6 or 10 female rats. Dahl S, Dahl salt-sensitive; SD, Sprague Dawley.

