
Figure 4.
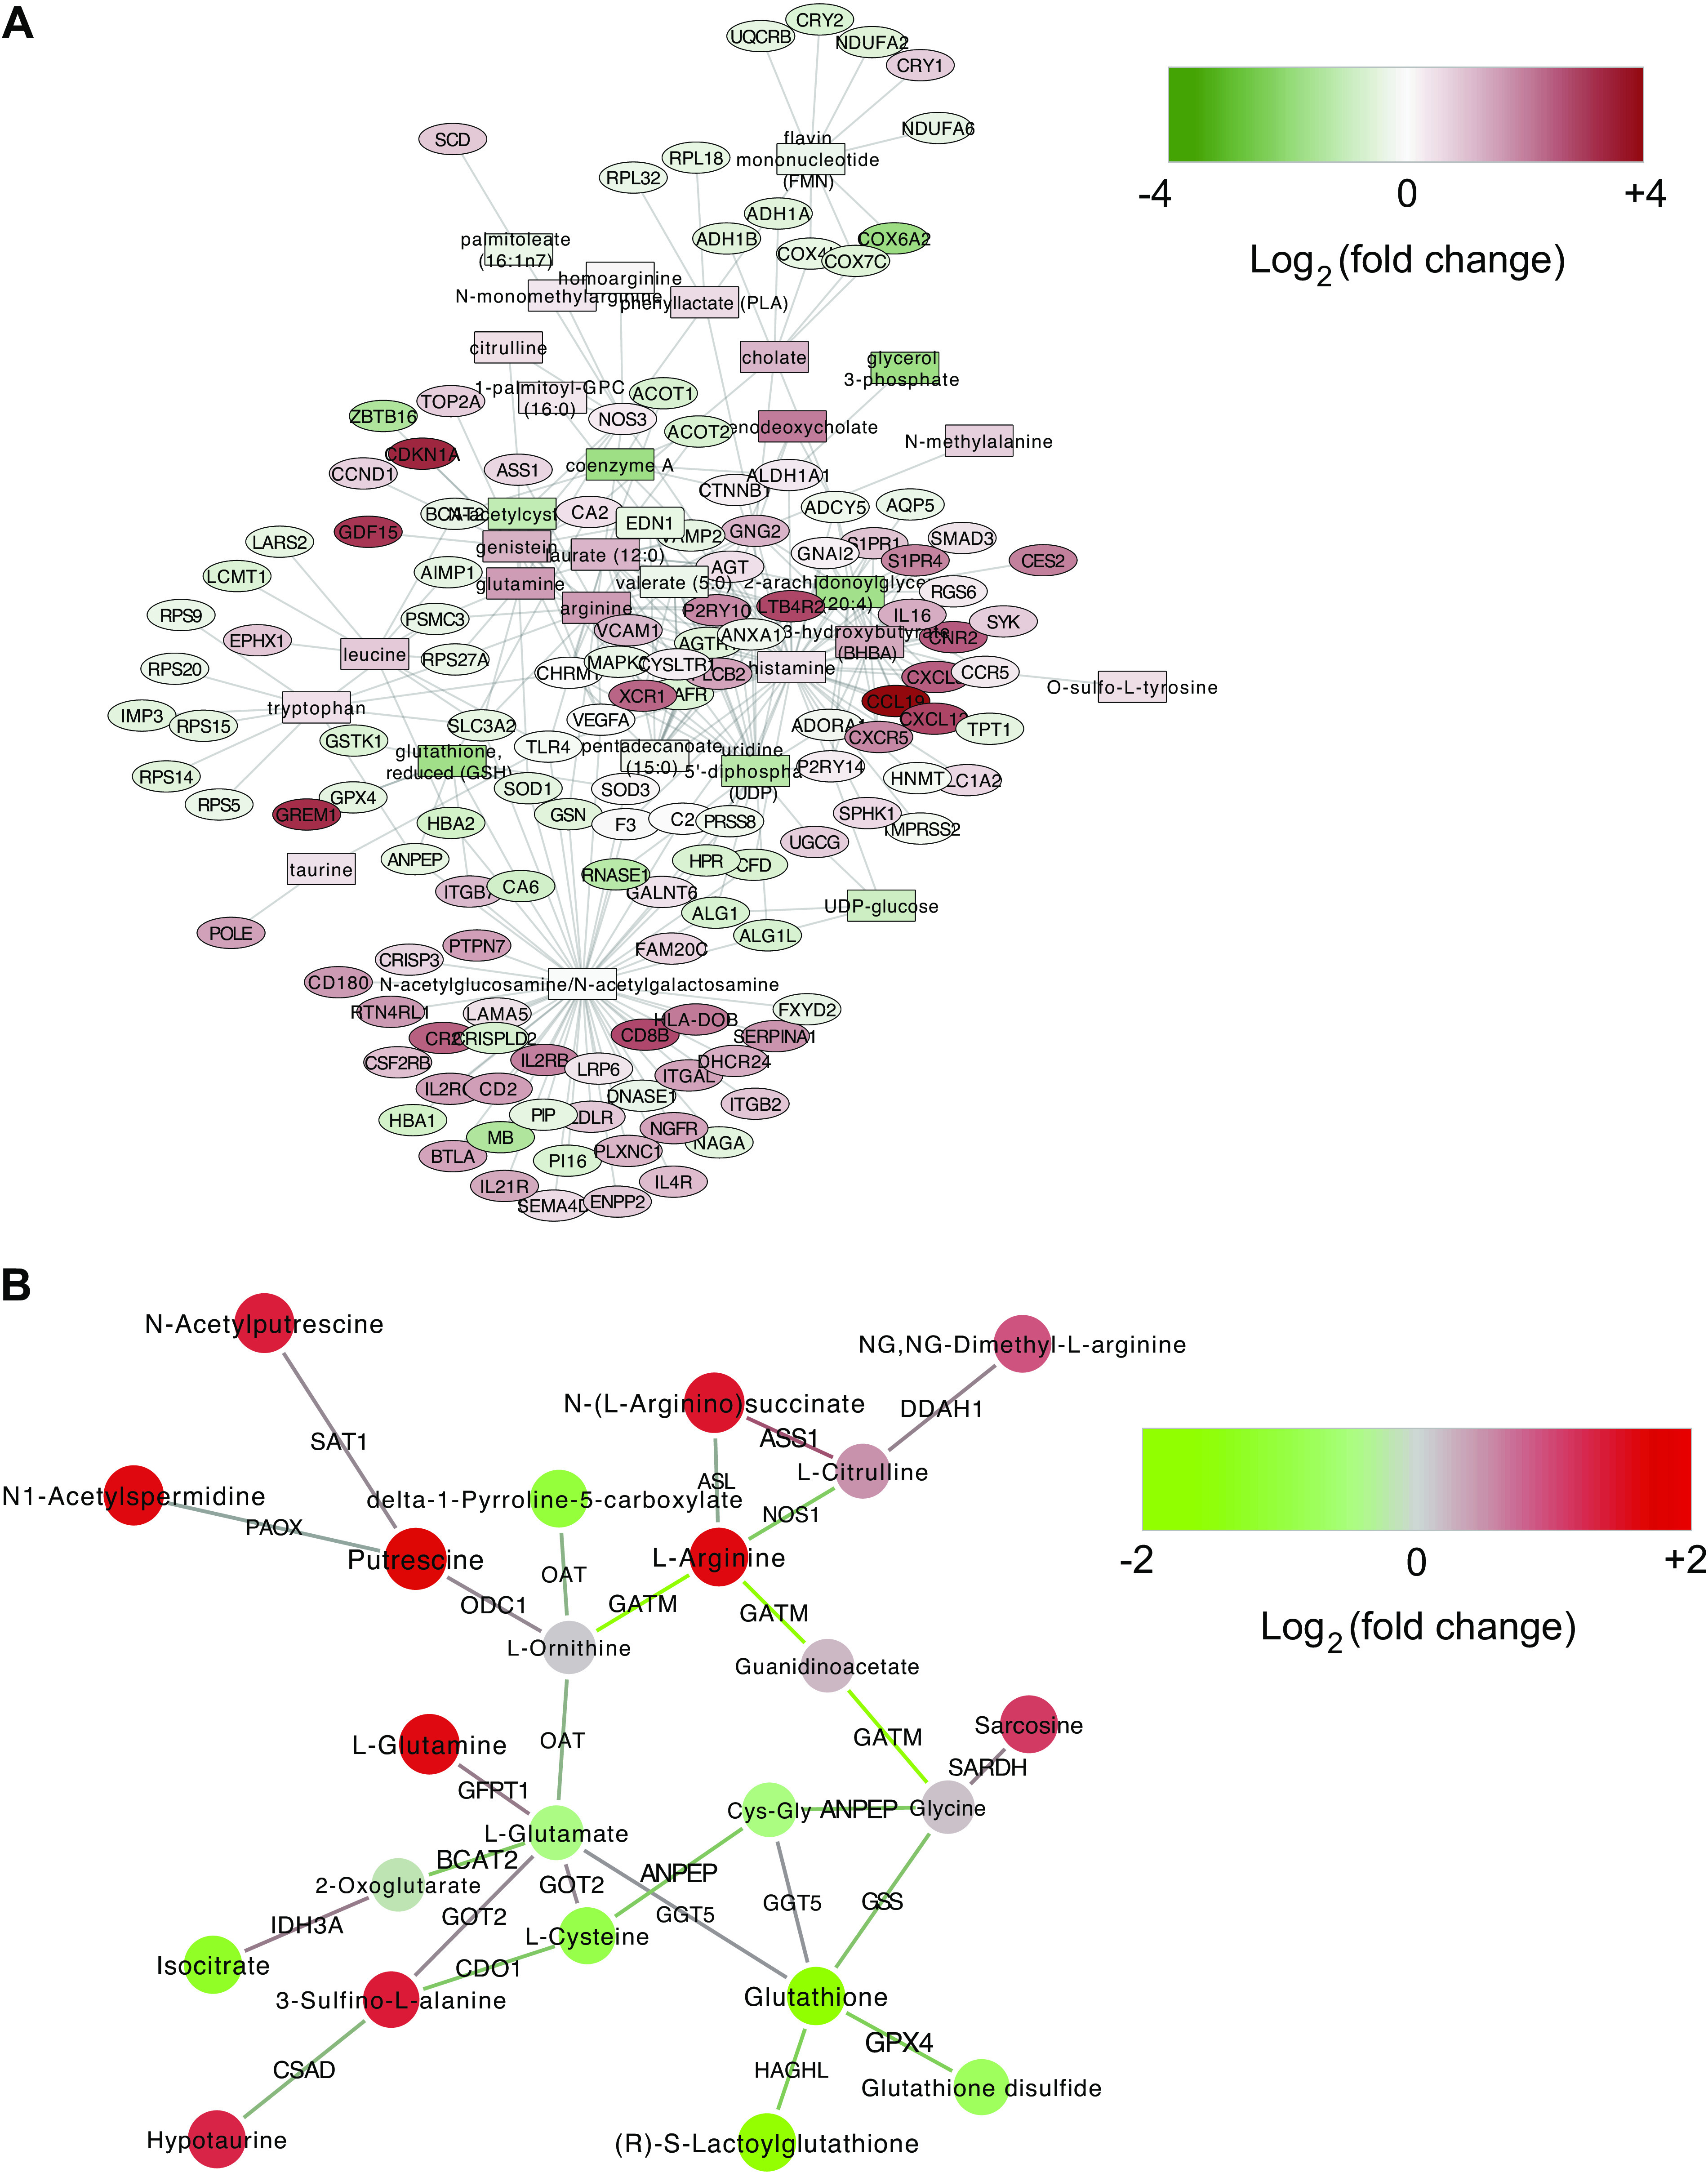
Active module analysis. A: top-scoring module from jActiveModules analysis in Cytoscape. Rectangles indicate metabolites and ovals indicate genes. B: active module found by the Shiny app Genes And Metabolites (GAM). Circles represent metabolites and edges are labeled by genes that help catalyze the metabolic reactions between those metabolites.