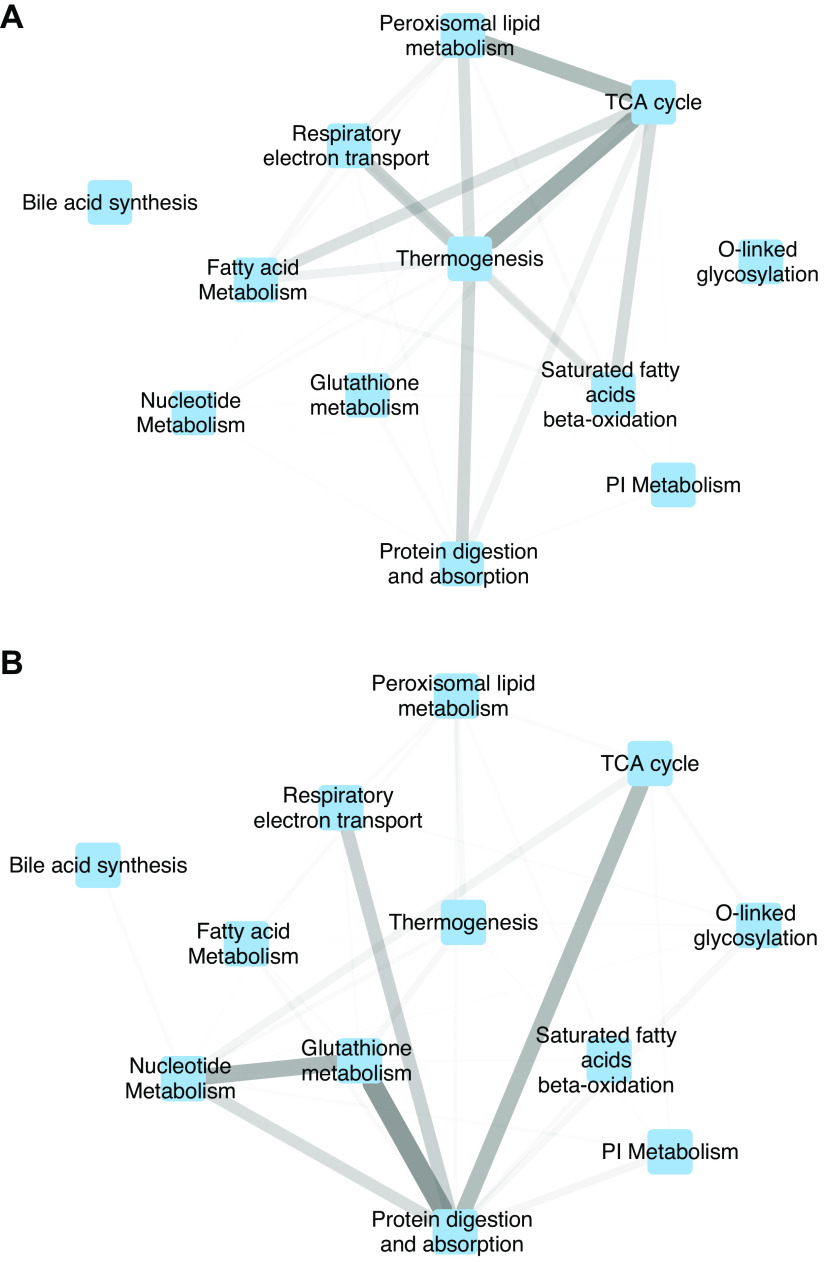
Figure 5.
Metanetwork showing interactions between pathways. Nodes represent manually selected set of 12 significantly enriched metabolic pathways. Edge weights between pathways correspond to the total strength of protein-chemical interactions from the STITCH database between members of those pathways. Edge width and transparency are both proportional to edge weight. A: baseline network: all measured genes and metabolites in each pathway are included. B: perturbed network: only the leading edge genes and metabolites (i.e., those most altered by irradiation) are included from each pathway.

