Figure 4.
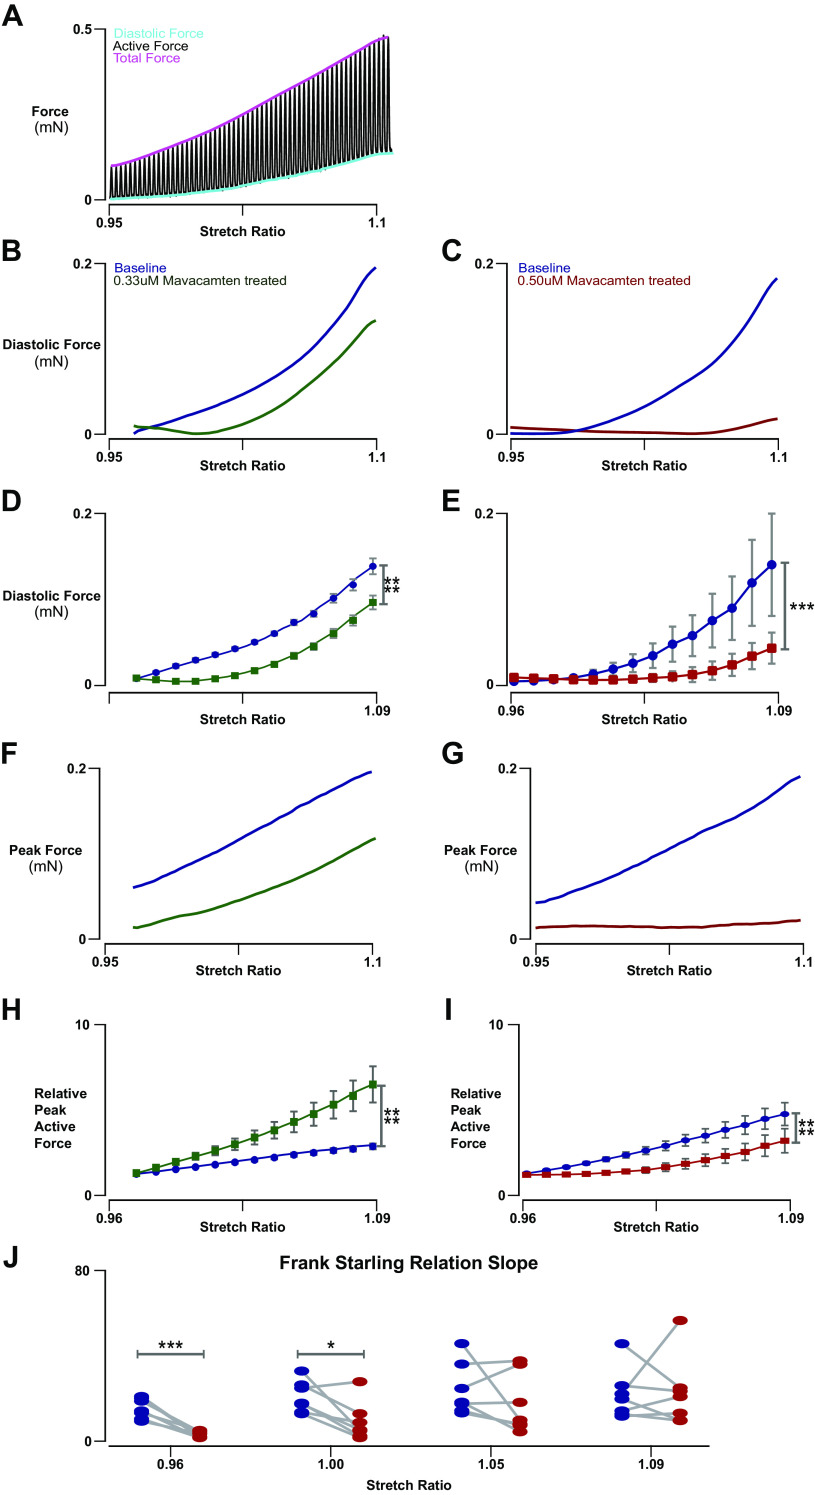
Force-length characteristics of baseline and mavacamten-treated engineered heart tissues (EHTs). A: representative trace of full-force recording of an EHT undergoing constant slow linear stretch from 0.95 to 1.10 stretch while being stimulated at 1 Hz. B: representative diastolic force-length trace of an EHT from 0.96 to 1.10 stretch ratio at 1-Hz stimulus with and without 0.33 µM mavacamten acute treatment. C: representative diastolic force-length trace of an EHT from 0.95 to 1.10 stretch ratio at 1-Hz stimulus with and without 0.5 µM mavacamten acute treatment. D: 0.33 µM mavacamten significantly altered the effect of stretch on diastolic force (n = 5, 2-way ANOVA, repeated measures by stretch and by drug treatment, interaction P < 0.0001). E: 0.50 µM mavacamten significantly altered the effect of stretch on diastolic force (n = 7, 2-way ANOVA, repeated measures by stretch and by drug treatment, interaction P = 0.0010). F: representative active force-length trace of an EHT from 0.96 to 1.10 stretch ratio at 1-Hz stimulus with and without 0.33 µM mavacamten acute treatment. G: representative active force-length trace of an EHT from 0.95 to 1.10 stretch ratio at 1-Hz stimulus with and without 0.50 µM mavacamten acute treatment. H: 0.33 µM mavacamten significantly altered the effect of stretch on the Frank-Starling active force relationship (n = 5, 2-way ANOVA, repeated measures by stretch and by drug treatment, interaction P < 0.0001). I: 0.50 µM mavacamten significantly altered the effect of stretch on the Frank-Starling active force relationship (n = 7, 2-way ANOVA, repeated measures by stretch and by drug treatment, interaction P < 0.0001). J: mavacamten at 0.50 µM reduced the slope of the Frank-Starling active force relation at lower stretch (n = 7, paired t test, P < 0.0001 at 0.96 stretch ratio). *P < 0.05, ***P < 0.001, and ****P < 0.0001.

