
Figure 2.
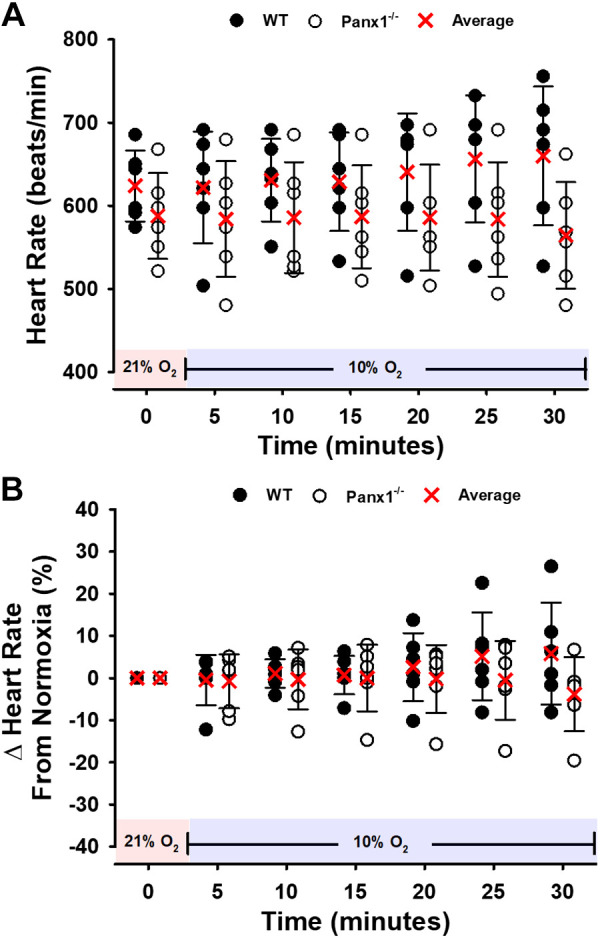
Heart rate (HR) for WT or Panx1−/− mice during a 30-min hypoxic challenge. Individual values and means ± SD are shown. A and B: absolute values and percent change from baseline. n = 6 for WT mice (4 males, 2 females) and n = 6 for Panx1−/− mice (6 males). Red shading denotes normoxia (21% FiO2) and blue shading denotes hypoxia (10% FiO2). Panx1, pannexin 1; WT, wild-type.