
Figure 3.
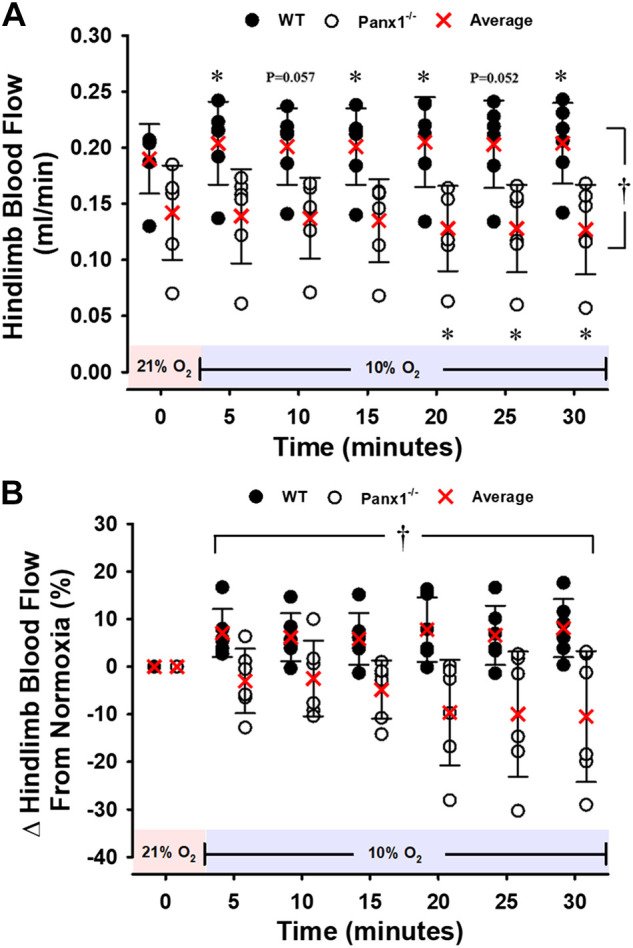
Hindlimb blood flow (HBF) for WT or Panx1−/− mice during a 30-min hypoxic challenge. Individual values and means ± SD are shown. A and B: absolute values and percent change from baseline. *P < 0.05 vs. respective baseline. †P < 0.05 compared to WT as determined by two-way repeated-measures ANOVA with Student–Newman–Keuls post hoc analysis. n = 6 for WT mice (5 males, 1 females) and n = 6 for Panx1−/− mice (5 males, 1 females). Red shading denotes normoxia (21% FiO2) and blue shading denotes hypoxia (10% FiO2). Panx1, pannexin 1; WT, wild-type.