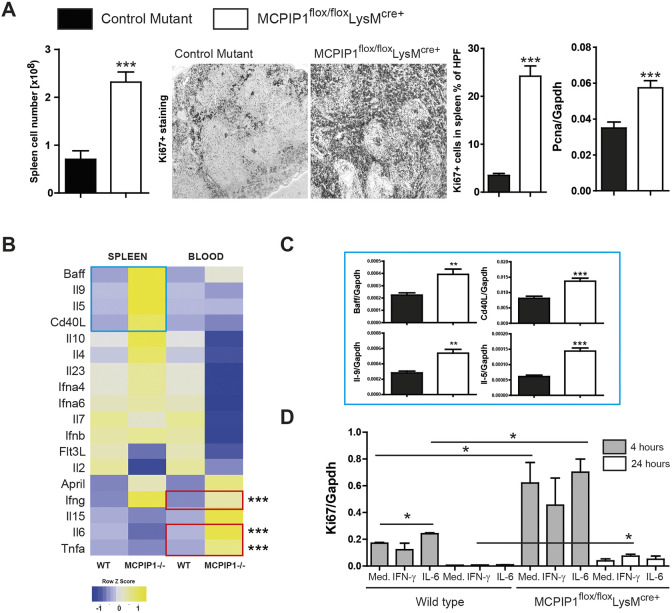
Fig. 2.
MCPIP1 regulates the proliferation of splenocytes. (A) Splenocytes were quantified by flow cytometry; spleen sections were stained with Ki67 proliferation marker and quantified using image software as described in the Materials and Methods (magnification ×100). RNA was isolated from knockout and control mice for real-time PCR analysis. Data are expressed as means of the ratio of Pcna versus that of Gapdh mRNA. Data are means±s.e.m. from at least eight mice per group; ***P<0.001 versus control mice. (B) Heat map depicting the splenic and whole-blood expression of pre-selected genes of wild type and MCPIP1 knockouts. Red frames mark the genes that were significantly upregulated in the blood; blue frames mark the genes that were considerably changed in the spleen. (C) Genes that were considerably changed in the spleen were investigated in a larger sample (eight wild type versus eight knockouts). (D) Freshly isolated splenocytes were stimulated with selected cytokines to investigate their potential role in splenomegaly. Expression levels of transcripts were quantified by real-time PCR. Data are shown as means of the ratio of the specific mRNA versus that of Gapdh mRNA; *P<0.05, **P<0.01, ***P<0.001.

