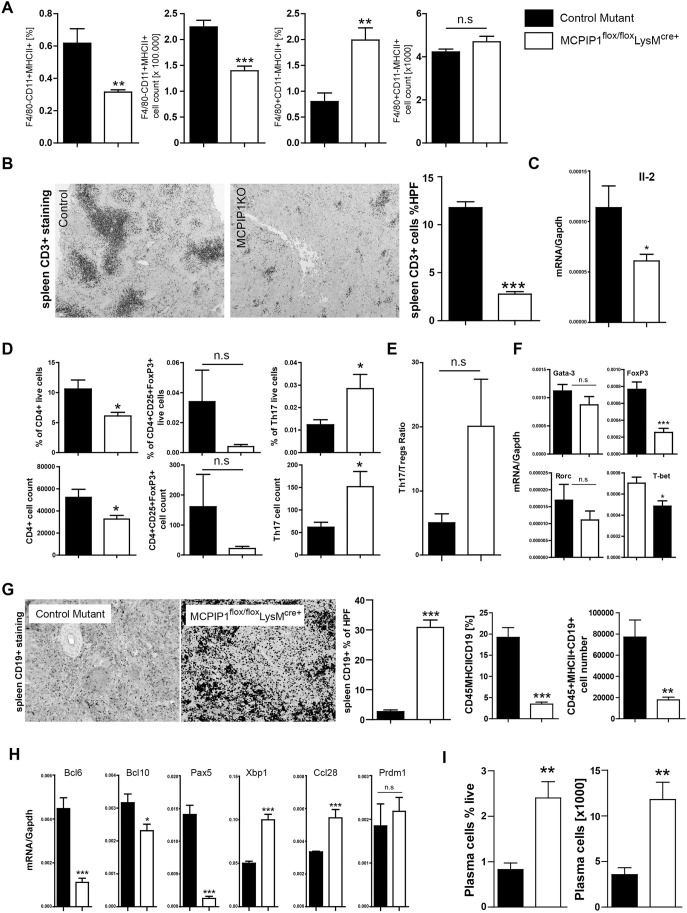
Fig. 3.
MCPIP1 suppresses the activation of macrophages and, indirectly, Th17 lymphocytes and B-cell subsets. (A) The total number of CD11c+ dendritic cells and F4/80+ macrophages and their activation in spleens was quantified by flow cytometry in both investigated genotypes as described in the Materials and Methods. Data represent means±s.e.m. from at least eight mice per group. **P<0.01, ***P<0.001 versus control mice. (B) Spleen sections were stained for CD3+ T cells and quantified with image software as described in the Materials and Methods (magnification ×100). Data are means±s.e.m. from at least eight mice per group; ***P<0.001. RNA was isolated from spleens, and mRNA levels in spleen were analyzed for relevant transcripts. (C) Expression levels of Il2 were quantified by real-time PCR. Data are shown as means of the ratio of the specific mRNA versus that of Gapdh mRNA; *P<0.05. (D,E) The total numbers of the CD4+ T-cell subset (D) and Th17/Treg ratio (E) were quantified by flow cytometry in both investigated genotypes as described in the Materials and Methods. Data represent means±s.e.m. from at least eight mice per group. *P<0.05 versus control mice. (F) mRNA levels of T-cell-relevant transcription factors in spleens were quantified by real-time PCR. Data are shown as means of the ratio of the specific mRNA versus that of Gapdh mRNA; *P<0.05, ***P<0.001 versus control mice. (G) Spleen sections were stained for CD19+ B cells and quantified with image software as described in the Materials and Methods (magnification ×200). Data are means±s.e.m. from at least eight mice per group; ***P<0.001. The total numbers of spleen B220+/CD19+/MHCII+ cells were quantified in 6-month-old mice by flow cytometry. Data are means±s.e.m. of at least eight mice per group; **P<0.01, ***P<0.001 versus control mice. (H) mRNA levels in the spleen were analyzed for B-cell survival and stimulatory factors. Expression levels were quantified by real-time PCR. Data are shown as means of the ratio of the specific mRNA versus that of Gapdh mRNA; *P<0.05, ***P<0.001. (I) Mature B cells and kappa light chain+ CD138+ (also known as Sdc1+) plasma cells were quantified in 6-month-old mice by flow cytometry. Data are means±s.e.m. of at least eight mice per group; **P<0.01 versus control mice. n.s., not significant.

