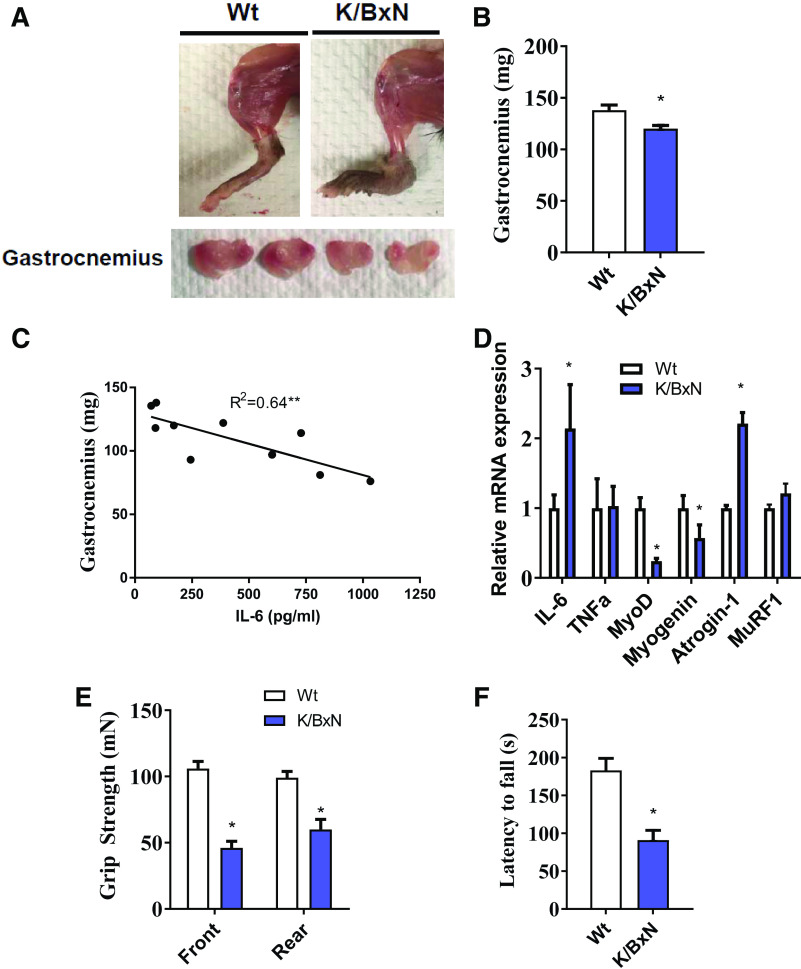
Figure 3.
Muscle atrophy in the K/BxN mouse model. A: representative images of hindlimb (upper) and gastrocnemius muscle (lower) from wild-type (Wt) and K/BxN mice. B: gastrocnemius muscle weight in wild-type and K/BxN mice (n = 10/group; two-tailed t test, *P < 0.05). C: regression analysis showing a correlation between gastrocnemius weight and plasma IL-6 concentrations (n = 10 male K/BxN mice; regression analysis, *P < 0.05). D: mRNA expression in the gastrocnemius muscle of wild-type and K/BxN mice. Front and rear paw grip strength (E) and time to fall during RotoRod analysis (F). (For D–F, n = 10/group; two-tailed t test, *P < 0.05). Data are presented as means ± SE.

