Figure 1.

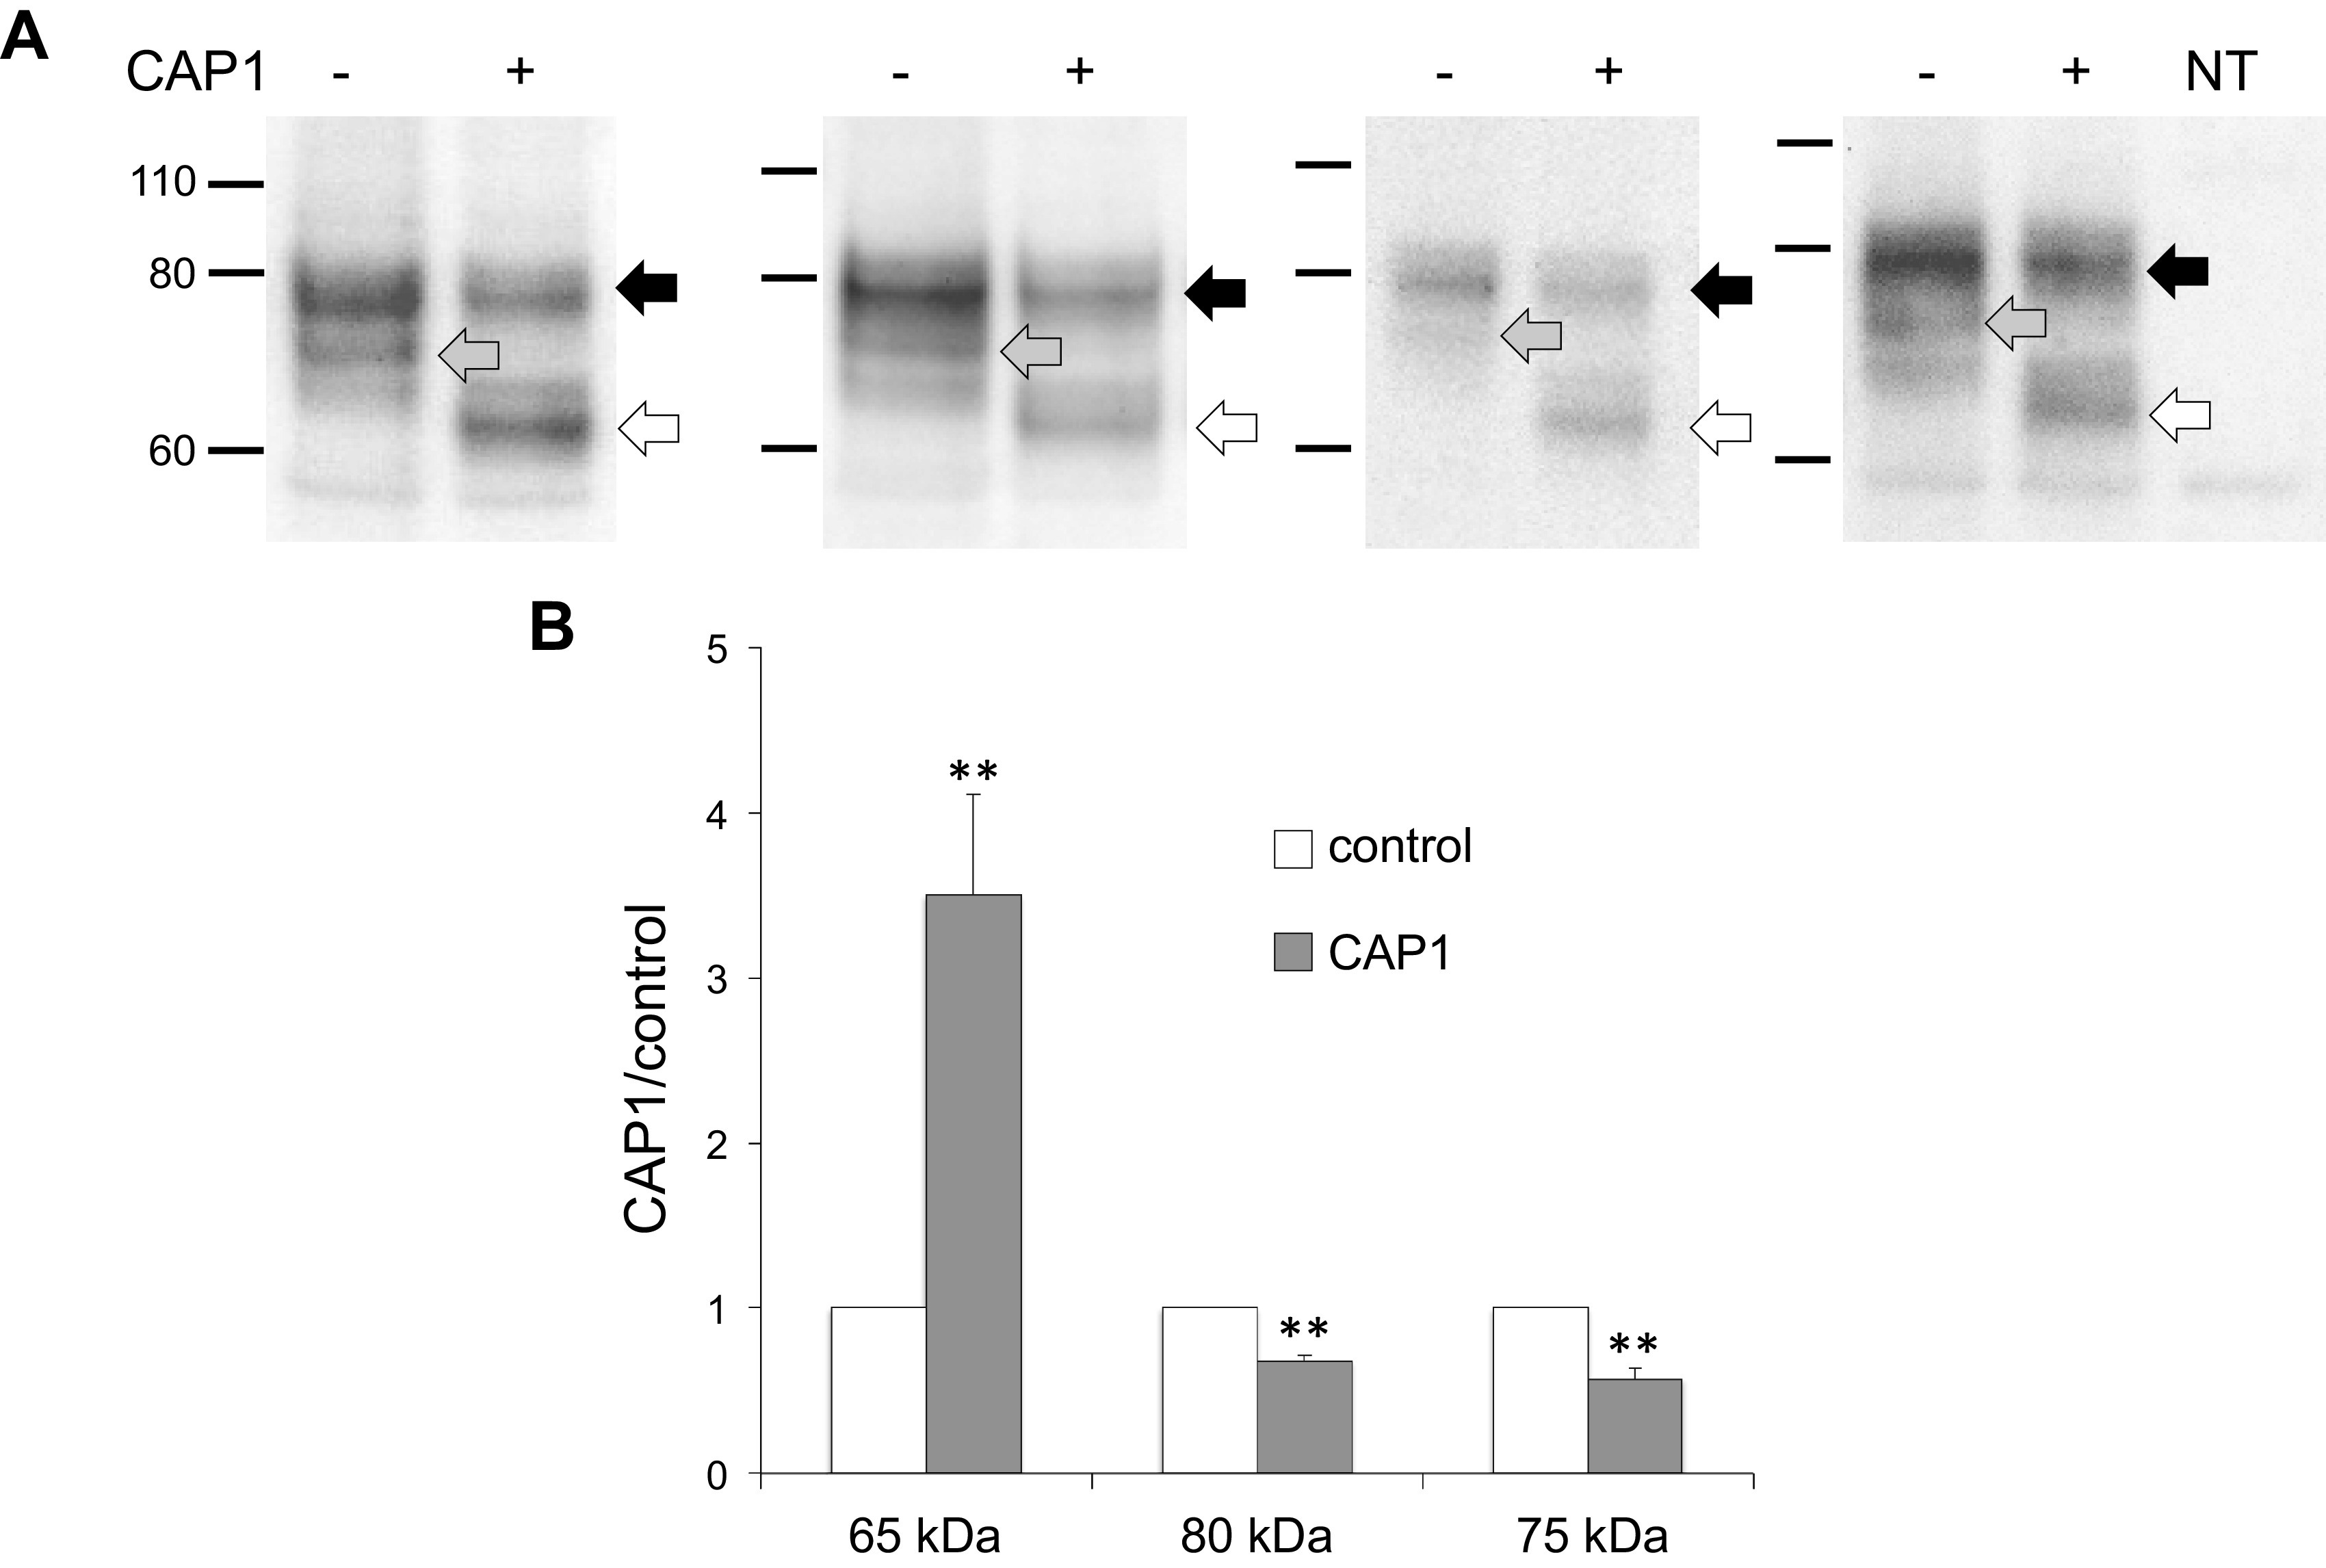
Western blots of γENaC expressed in FRT cells. A: cells were transfected with WT γENaC together with αENaC and βENaC, with or without CAP1. Each pair of lanes represents a different transfection. Each lane was loaded with 10 µL of lysate from a different filter. CAP1 increased the abundance of a cleaved form of the subunit migrating at ∼65 kDa (white arrows) and decreased the intensities of the full-length species (black arrows) and of a diffuse band migrating around 75 kDa (gray arrows). The narrow band below 60 kDa is nonspecific, as it was also observed in nontransfected cells (right lane). B: densitometry of 80 kDa, 75 kDA, and 65 kDa bands from the blots in (A). Data were normalized in the absence of CAP1 and represent means ± SE; n = 4. **P < 0.01 vs. control by a paired two-tailed t test. CAP1, channel activating protease 1; ENaC, epithelial Na channel; FRT, Fisher rat thyroid; WT, wild-type.
