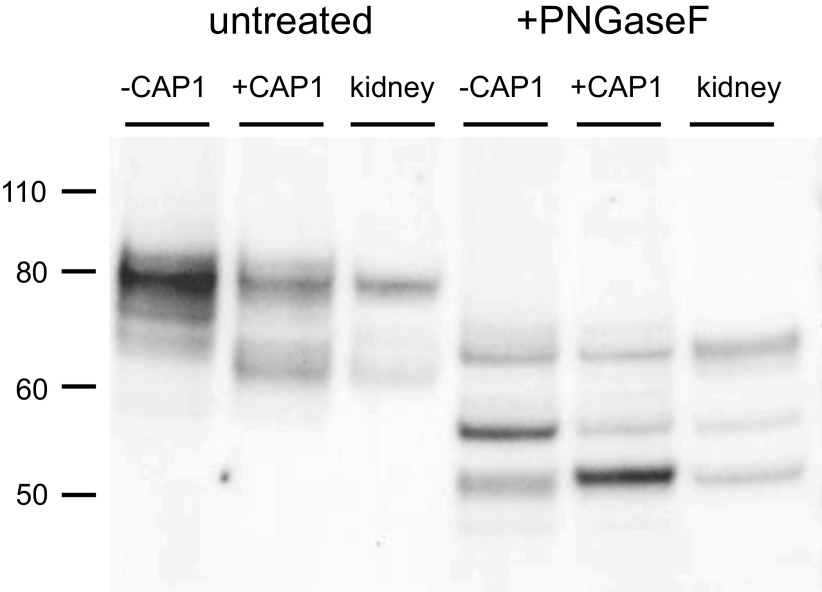
Figure 3.
Western blot of γENaC expressed in FRT cells and in mouse kidney before and after treatment with PNGaseF. Cells were transfected with untagged WT γENaC together with αENaC and βENaC, with or without CAP1. Kidney microsomes (30 µg protein) were obtained from a mouse on a control diet. FRT cell lanes were loaded with samples from 7 µL (untreated) or 10 µL (PNGaseF-treated) of cell lysate. As in Fig. 1., CAP1 increased the abundance of a cleaved form of the subunit migrating at ∼65 kDa before PNGaseF treatment. Kidney microsomes showed a presumed full-length subunit migrating at 80 kDa and a major cleaved form at 65 kDa. After PNGaseF treatment three major bands were observed in both FRT cells and kidney samples. These corresponded to a full-length species at 65 kDa, a furin-cleaved form at 55 kDa, and a fully cleaved form at 50 kDa. CAP1 increased the amount of the 50 kDa species and decreased that of the 55 kDa form. The blot is representative of three separate experiments. CAP1, channel activating protease 1; ENaC, epithelial Na channel; FRT, Fisher rat thyroid; WT, wild-type.

