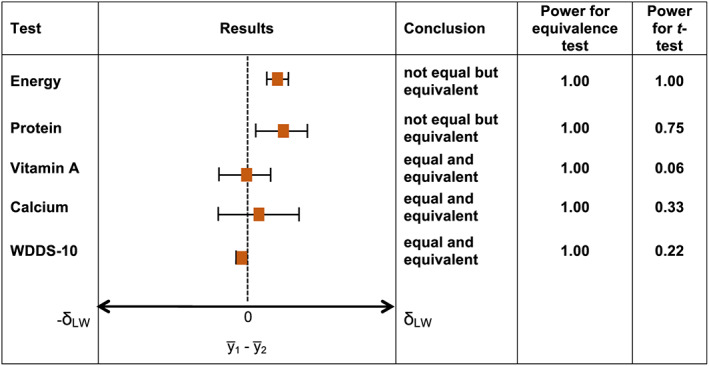
FIGURE 3.

Significant differences and similarities in nutrient intakes for lactating women (LW) versus nonpregnant, nonlactating women. Note. Significant difference and equivalence tested at α = 0.05; horizontal T‐shaped bars depict 95% confidence intervals for difference testing. Difference is statistically significant and conclusion is “not equal” if 95% confidence interval does not include zero. Equivalence is statistically significant and conclusion is “equivalent” if 90% confidence interval (obtained from two one‐sided tests with an α of 0.05 and using the formula 100[1–;2α]%) is contained in the interval with endpoints −δ PW and +δ PW defined for each nutrient in Table 1b
