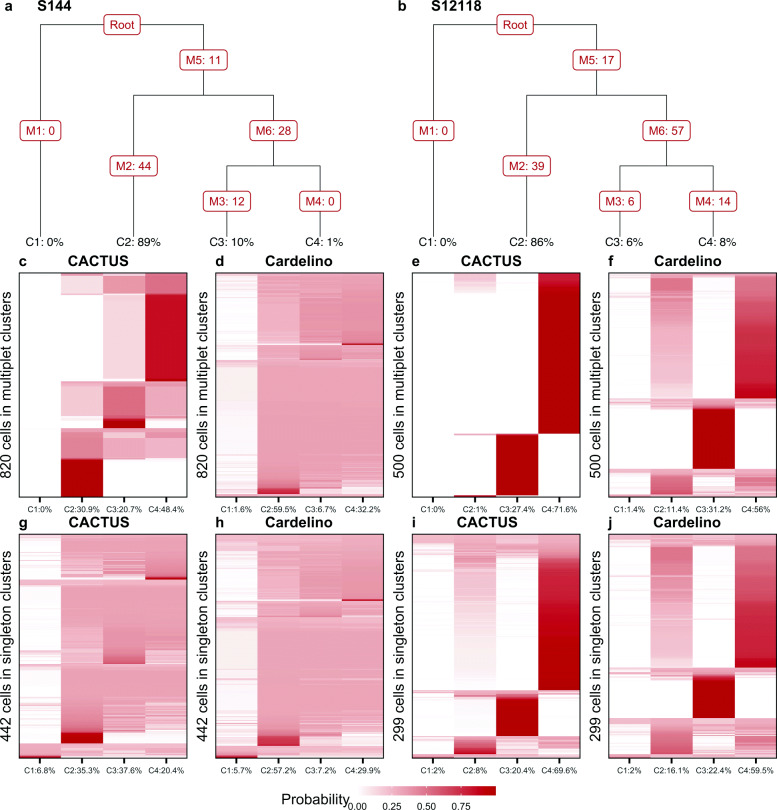
Fig. 5.
Confidence of cell assignment to the tumor clones. a, b Evolutionary trees inferred by Canopy [9] for subject S144 (a) and S12118 (b). Leaf labels: clone prevalences. Branch labels: numbers of acquired mutations. Canopy considers also CNVs, but they are not used for cell-to-clone mapping and hence not visualized here. Thus, the branch labels can be zero when the alterations acquired along that branch are copy number changes. Clone 1 corresponds to the base, normal clone. In tree a, clone 4 (C4) differs from clone 3 (C3) by the 12 SNVs acquired on the branch leading to the leaf C3. c–j Shades of brown indicate the probability of assignment of cells (y axis) to the clones (x axis; labeled with corrected prevalences, computed as the fraction of single cells assigned to the clones) by CACTUS (c, g, e, i) and cardelino [21] (d, h, f, j). For cells in multiplet BCR clusters (second row), CACTUS yields higher confidence of cell-to-clone assignment (c, e) than cardelino (d, f). For cells in singleton BCR clusters (third row) for subject S144, the confidence of cell-to-clone assignment by CACTUS (g) is similarly weak as by cardelino (h), while for S12118 and for CACTUS (i), the confidence is higher than for cardelino (j)

