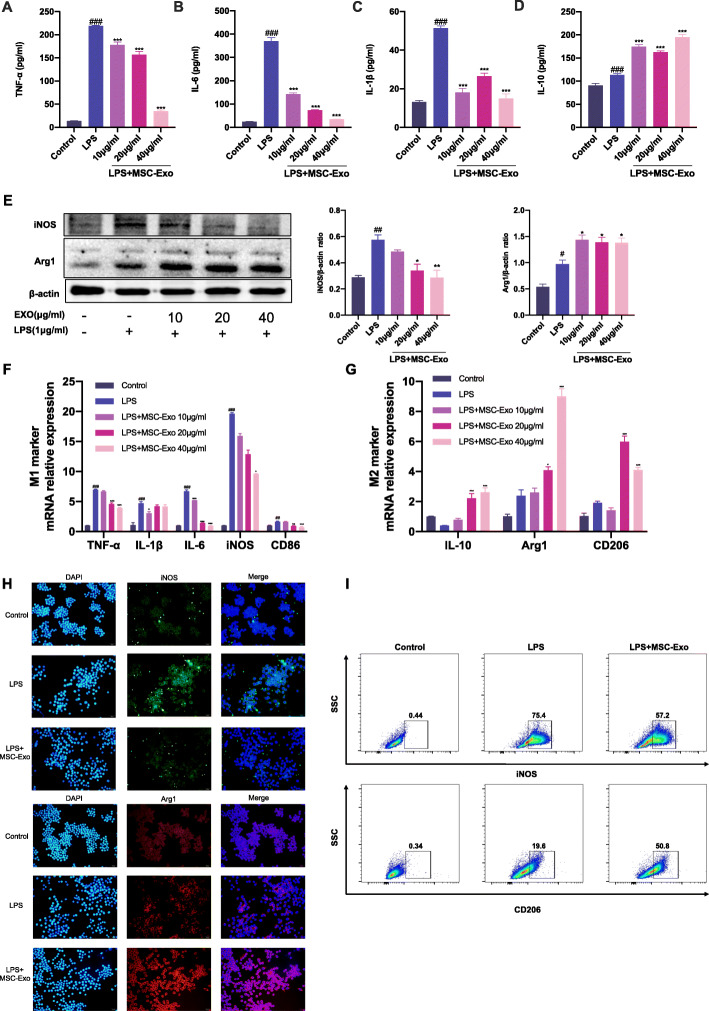
Fig. 5.
Effect of MSC-Exo on inflammation and macrophage polarization in LPS-stimulated RAW 264.7 cells. a–g RAW 264.7 cells were stimulated by LPS for 12 h, followed by the treatment of MSC-Exo (10, 20, 40 μg/ml) for 24 h. a–d Levels of TNF-α, IL-6, IL-1β, and IL-10 in culture supernatants of RAW 264.7 cells of different groups. e Western blotting image and quantification of iNOS and Arg1 expression in RAW 264.7 cells of different groups. β-actin was used as internal reference. f, g qRT-PCR analysis of mRNA level of M1 markers TNF-α, IL-6, IL-1β, iNOS, CD86, and M2 markers IL-10, Arg1, and CD206 in RAW 264.6 cells of different groups. h, i RAW 264.7 cells were stimulated by LPS for 12 h, followed by the treatment of MSC-Exo (20 μg/ml) for 24 h. h Representative images of immunofluorescence staining of iNOS and Arg1 in RAW 264.7 cells of different groups. i Representative images of flow cytometry analysis of iNOS and CD206 in RAW 264.7 cells of different groups. Data are presented as the mean ± SEM (n = 3) (#p < 0.05, ##p < 0.01, ###p < 0.001 vs. the control group; *p < 0.05, **p < 0.01, ***p < 0.001 vs. the LPS group)

