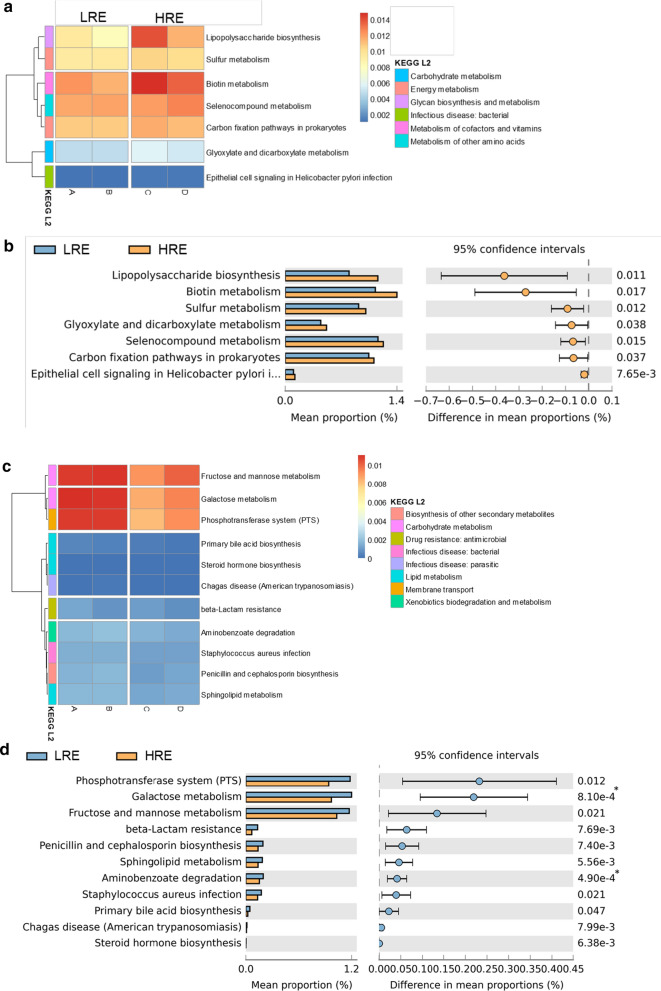
Fig. 6.
Differentially enriched functions in COPD patients by PICRUSt analysis. Comparison of the relative abundance of the PICRUSt-generated functional profile of the sputum microbiome in COPD patients. Upregulated KEGG pathways associated with HRE subjects are plotted as a heatmap (a) and bar graph (b). Bonferroni-adjusted p-values < 0.05/7 = 0.0071 indicate significance. Upregulated KEGG pathways associated with LRE subjects are plotted as a heatmap (c) and bar graph (d). Bonferroni-adjusted p-values < 0.05/11 = 0.0045 indicate significance. GOLD A, B, C, and D were identified via the GOLD 2017 classification. LRE low-risk exacerbator, HRE high-risk exacerbator

