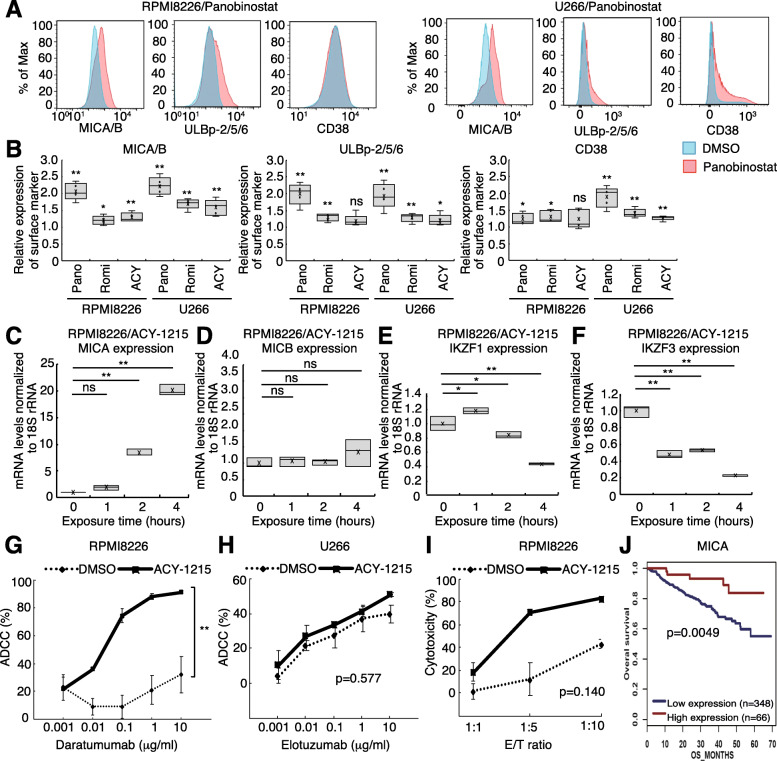
Fig. 1.
HDAC inhibitors enhance NK cell activity via NKG2D ligand upregulation and IKZF1/3 downregulation. a Histograms of MICA/B, ULBp-2/5/6, and CD38 expression in RPMI8226 and U266 cells treated with panobinostat for 24 h. b Summary of the ratio of mean fluorescence intensity (MFI) for MICA/B, ULBp-2/5/6, and CD38 expression between cells exposed to HDAC inhibitors [Panobinostat (Pano), Romidepsin (Romi), ACY-1215 (ACY)]. The MFI values of MICA/B, ULBp-2/5/6, and CD38 of MM cells upon exposure to each HDAC inhibitor were divided by the corresponding MFI values upon exposure to DMSO. Experiments were repeated 5 times. Error bars represent the SD. (*p < 0.05, **p < 0.01, “ns” indicates no significant difference). c–f MICA, MICB, IKZF1/3 mRNA levels in RPMI8226 cells exposed to ACY-1215. Experiments were performed in triplicate (n = 3). (*p < 0.05, “ns” indicates no significant difference). g–i ADCC and NK cell assay of daratumumab and elotuzumab in the presence of ACY-1215. Experiments were repeated three times (n = 3). Error bars represent the SD. (**p < 0.01) j Prognostic value of MICA expression based on MM patient clinical trial data

