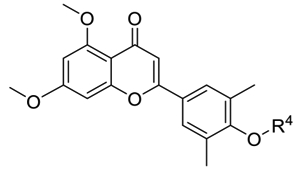
Table 3.
Inhibitory Rates of Series III Compounds on TLR3-Induced Expression of Proinflammatory Genes at a Concentration of 10 μMa
 |
|||
|---|---|---|---|
| Compounds | R4 | CIG5 (%) | IL-6 (%) |
| 3 |  |
84 ± 8.8 | 65 ± 5.7 |
| 37 |  |
83 ± 7.7 | NTb |
| 39 | 97 ± 10.5 | 98 ± 11.4 | |
| 42 |  |
100 ± 9.8 | 100 ± 11 |
| 43 |  |
99 ± 11 | 99 ± 9.2 |
| 44 |  |
99 ± 12 | 100 ± 11 |
| 45 |  |
91 ± 10 | 97 ± 9.3 |
| 46 |  |
42 ± 5.1 | 82 ± 9.6 |
| 47 |  |
63 ± 7.5 | 88 ± 9.3 |
| 48 |  |
92 ± 11 | 99 ± 11 |
| 49 |  |
−19 ± 2.5 | 82 ± 7.7 |
| 50 |  |
85 ± 9.3 | 90 ± 8.6 |
Inhibitory rates (%) are reported as the geometric mean of expression in the compound divided by that in solvent (×100). Data are derived from three independent measurements.
NT: Not tested.
