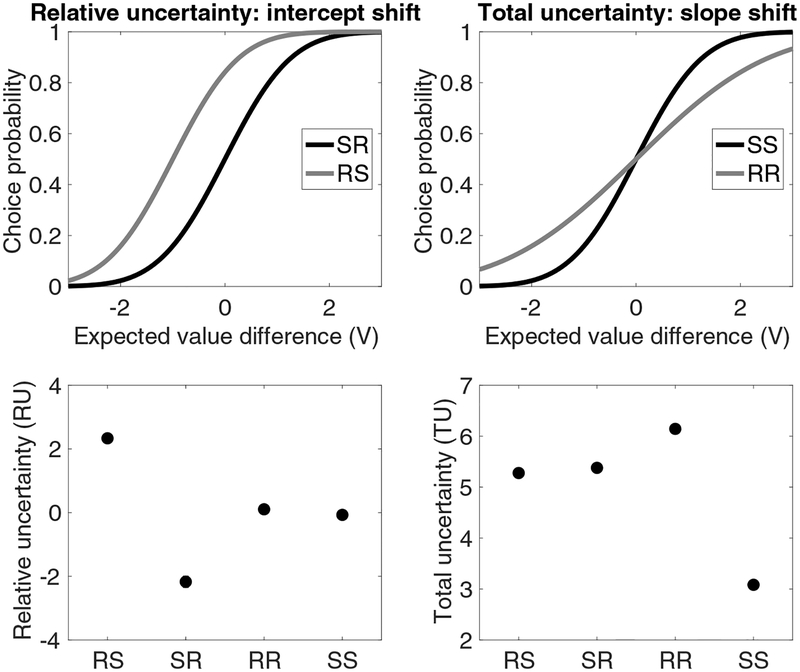
Figure 2: Relative and total uncertainty.
(Top) Illustration of how the probability of choosing option 1 changes as a function of the experimental condition and form of uncertainty. V represents the difference between the expected value of option 1 and the expected value of option 2. (Bottom) Average relative and total uncertainty in each condition. Conditions are denoted by safe/risky compounds; for example, “SR” denotes a trial in which option 1 is safe and option 2 is risky.

