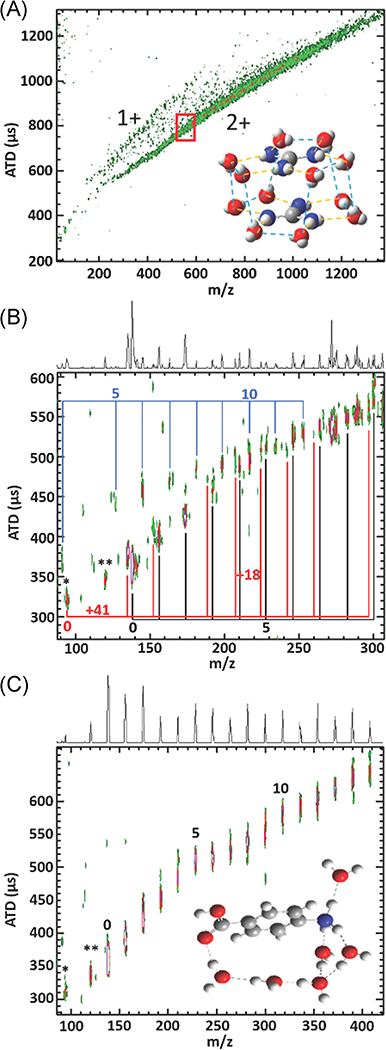
FIGURE 6.
(A) ATD is plotted as a function of m/z for a mixture of GdmH+(H2O)n (denoted 1+) with GdmH+(H2O)n and GdmH+-GdmH+(H2O)n (denoted 2+). The red box highlights where the ion abundance begins to decrease with decreasing hydration numbers. The inset shows a proposed structure of GdmH+-GdmH+(H2O)12. (B) ATD vs m/z plot of 4-ABAH+(H2O)n sprayed from 0.1% formic acid in H2O showing the change in the trendline at the n = 6 proton transfer from –NH3+ to –COHOH+. (C) ATD vs m/z plot of a mixture of H+(H2O)n, 4-ABAH+(H2O)n, and NH3 +C6H5(ACN)1(H2O)n clusters labelled in blue, black, and red, respectively, sprayed from 0.1% formic acid in 1:1 ACN/H2O. This plot shows no clear change in the trendline suggesting the –COHOH+ conformer persists. *denotes 94 m/z (CO2 loss) and **denotes 120 m/z (H2O loss). Adapted from Hebert and Russell (2019) and Hebert and Russell (2020). ATD, arrival time distribution.

