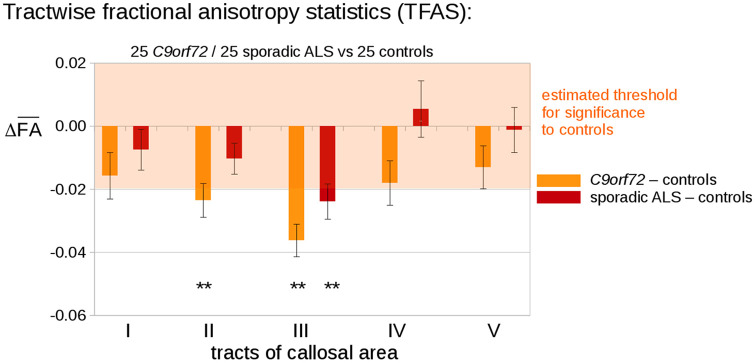
Figure 2.
TFAS at the group level for C9orf72 fALS patients compared with controls. TFAS demonstrated significant regional FA reductions in tracts of callosal areas II and III in C9orf72 fALS patients compared with matched controls and FA reductions in tracts of callosal area III in sporadic ALS patients. Error bars are SEM.
*p < 0.05, **p < 0.001 (Bonferroni-corrected).
ALS, amyotrophic lateral sclerosis; FA, fractional anisotropy; fALS, familial ALS; SEM, standard error of the mean; TFAS, tractwise fractional anisotropy statistics.

