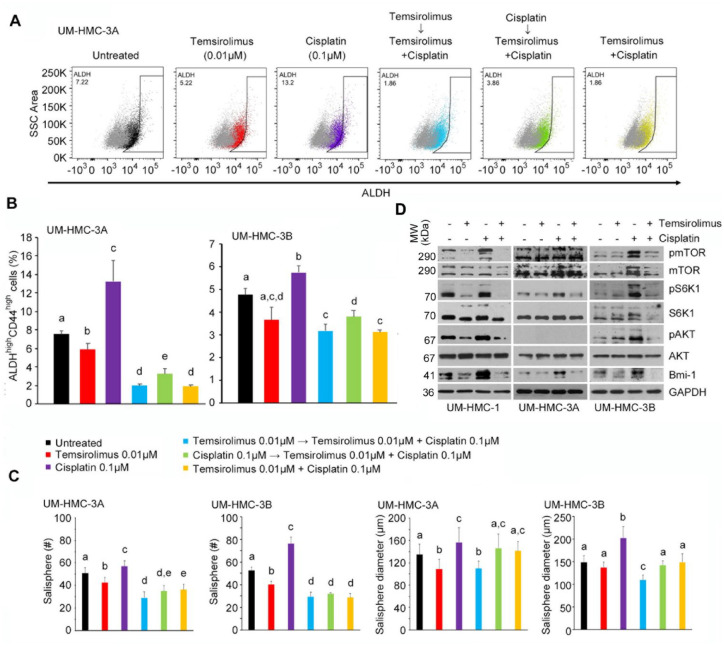
Figure 4.
Effect of combination therapy on cancer stem cells in vitro. (A) Flow cytometry analysis of UM-HMC-3A cells stained for ALDH. The horizontal axis shows ALDH staining, while vertical axis shows side scatter (SSC) area. (B) Bar graphs illustrate the percentage of ALDHhighCD44high cells in UM-HMC-3A and UM-HMC-3B cell lines treated with temsirolimus (red, 0.01 µM); cisplatin (purple, 0.1 µM); temsirolimus (0.01 µM) first, then both temsirolimus (0.01 µM) and cisplatin (0.1 µM) 24 h later (light blue); cisplatin (0.1 µM) first, then both temsirolimus (0.01 µM) and cisplatin (0.1 µM) 24 h later (green); or temsirolimus (0.01 µM) and cisplatin (0.1 µM) at the same time (yellow). (C) Bar graphs illustrate the average number and size of salispheres per well generated from UM-HMC-3A and UM-HMC-3B cell lines treated with temsirolimus (red, 0.01 µM); cisplatin (purple, 0.01 µM); temsirolimus (0.01 µM) first, then both temsirolimus (0.01 µM) and cisplatin (0.01 µM) 24 h later (light blue); cisplatin (0.01 µM) first, then both temsirolimus (0.01 µM) and cisplatin (0.01 µM) 24 h later (green); or temsirolimus (0.01 µM) and cisplatin (0.01 µM) the at same time (yellow). (D) Western blot analysis of UM-HMC-1, UM-HMC-3A, and UM-HMC-3B cells treated with temsirolimus (0 or 0.1 µM) and cisplatin (0 or 0.1 µM) for 24 h. Values are presented as mean ± SD. Different lowercase letters represent statistical significance at P < 0.05 as determined by 1-way analysis of variance followed by post hoc tests. Experiments were performed in triplicate wells per condition, and graphs represent at least 3 independent experiments.

