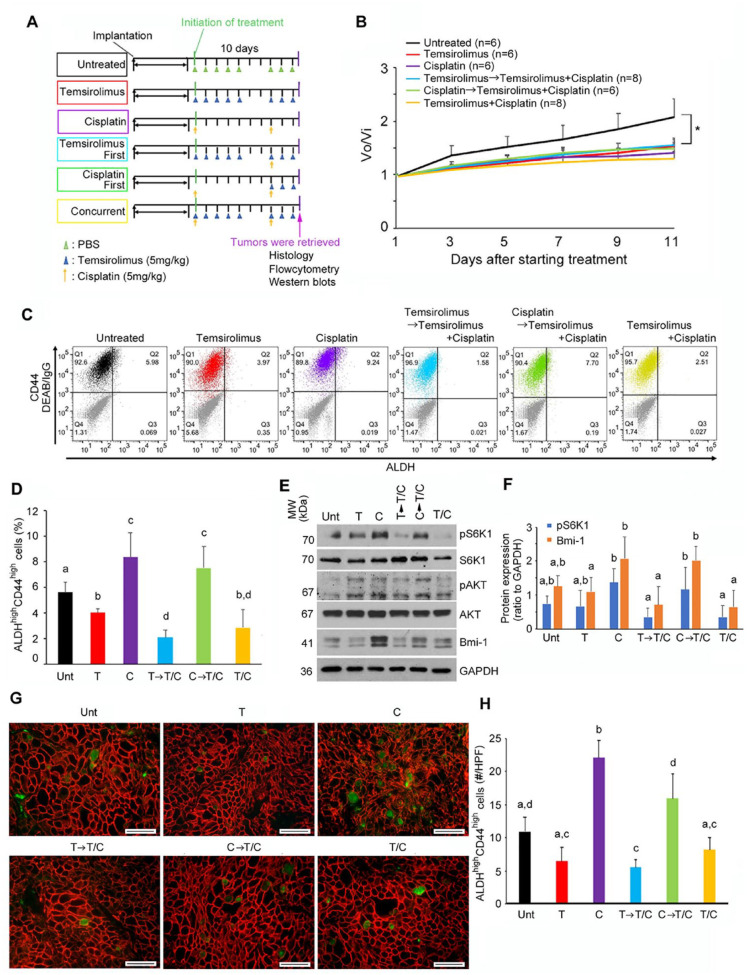
Figure 5.
Effect of combination therapy on cancer stem cells in vivo. (A) Treatment schema. Mice harboring patient-derived xenograft (PDX) tumors were treated with phosphate-buffered saline (PBS) intraperitoneally (IP) daily (days 1 to 5 and 8 to 10), temsirolimus alone (5 mg/kg/d, IP, days 1 to 5 and 8 to 10), cisplatin alone (5 mg/kg/d, IP, days 1 and 8), temsirolimus-first combination therapy (temsirolimus, 5 mg/kg/d, IP, days 1 to 5 and 8 to 10; cisplatin, 5 mg/kg, IP, day 8), cisplatin-first combination therapy (cisplatin, 5 mg/kg/d, IP, days 1 and 8; temsirolimus, 5 mg/kg/d, IP, days 8 to 10), and concurrent therapy (temsirolimus, 5 mg/kg/d, IP, days 1 to 5 and 8 to 10; cisplatin, 5 mg/kg, IP, days 1 and 8). (B) Line graph illustrates the observed tumor volume (Vo) normalized against initial tumor volume (Vi) immediately before treatment was initiated. UM-HMC-PDX-18 tumor treated with PBS (untreated, n = 6, black), temsirolimus (n = 6, red), cisplatin (n = 6, purple), temsirolimus-first combination therapy (n = 8, light blue), cisplatin-first combination therapy (n = 6, green), or temsirolimus and cisplatin at the same time (n = 8, yellow). (C) Flow cytometry analysis of UM-HMC-PDX-18 stained for ALDH and CD44. The horizontal axis shows ALDH staining, while the vertical axis shows CD44. (D) Bar graphs illustrate the percentage of ALDHhighCD44high cells in UM-HMC-PDX-18 treated with PBS (untreated [Unt], n = 6, black), temsirolimus (T; n = 6, red), cisplatin (C; n = 6, purple), temsirolimus-first combination therapy (T→T/C; n = 8, light blue), cisplatin-first combination therapy (C→T/C; n = 6, green), or temsirolimus and cisplatin at the same time (T/C; n = 8, yellow). (E, F) Western blot analysis of representative UM-HMC-PDX-18 tumor tissue lysates from each treatment group: Unt, T, C, T→T/C, C→T/C, and T/C. Bar graphs illustrate the quantification of pS6K1 and Bmi-1 normalized against GAPDH. Band densities were quantified with ImageJ software (National Institutes of Health). (G) Images show representative photographs of immunofluorescence staining of UM-HMC-PDX-18 tumor tissue sections stained for ALDH1 (green) and CD44 (red). Images were taken at 400× magnification, and scale bars represent 50 µm. (H) Bar graph illustrates the number of positive cells for ALDH1 and CD44 per high-power field (HPF; 400× magnification) in tissues from UM-HMC-PDX-18 mice treated with temsirolimus (red), cisplatin (purple), temsirolimus-first combination therapy (light blue), cisplatin-first combination therapy (green), or temsirolimus and cisplatin at the same time (yellow). Values are presented as mean ± SD. Different lowercase letters represent statistical significance at P < 0.05 as determined by 1-way analysis of variance followed by post hoc tests.

