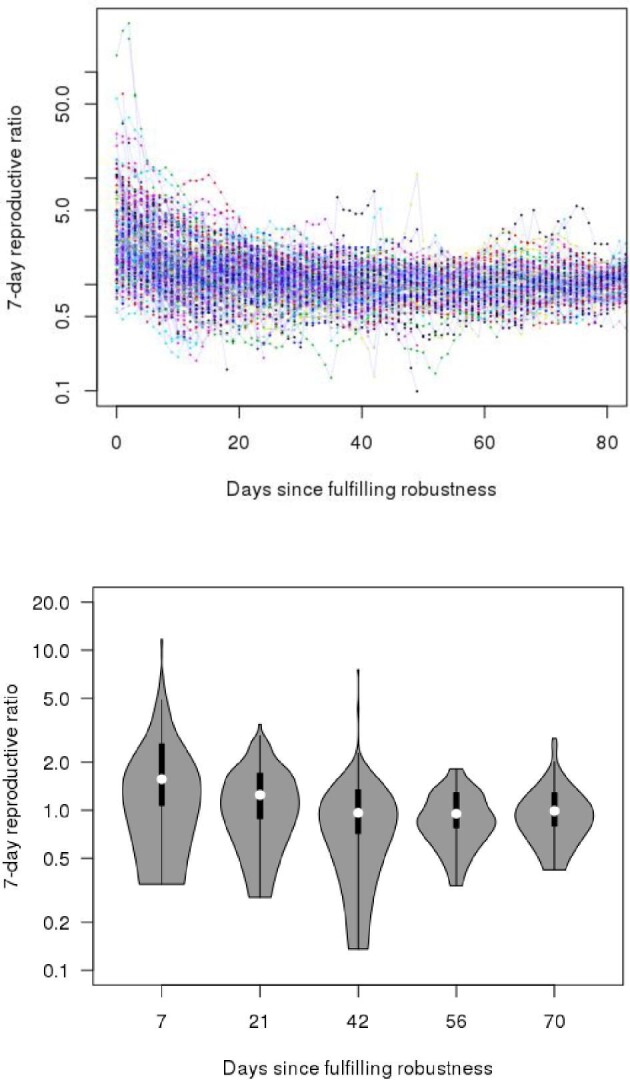
Figure 1.

Distribution of the empirical COVID-19 reproductive ratio over time in 140 countries fulfilling criteria for robust analysis. The upper panel shows the data of each country connected by lines, whereas the bottom panel shows violin plots of the reproductive ratios at selected time points.
