
Figure 3.
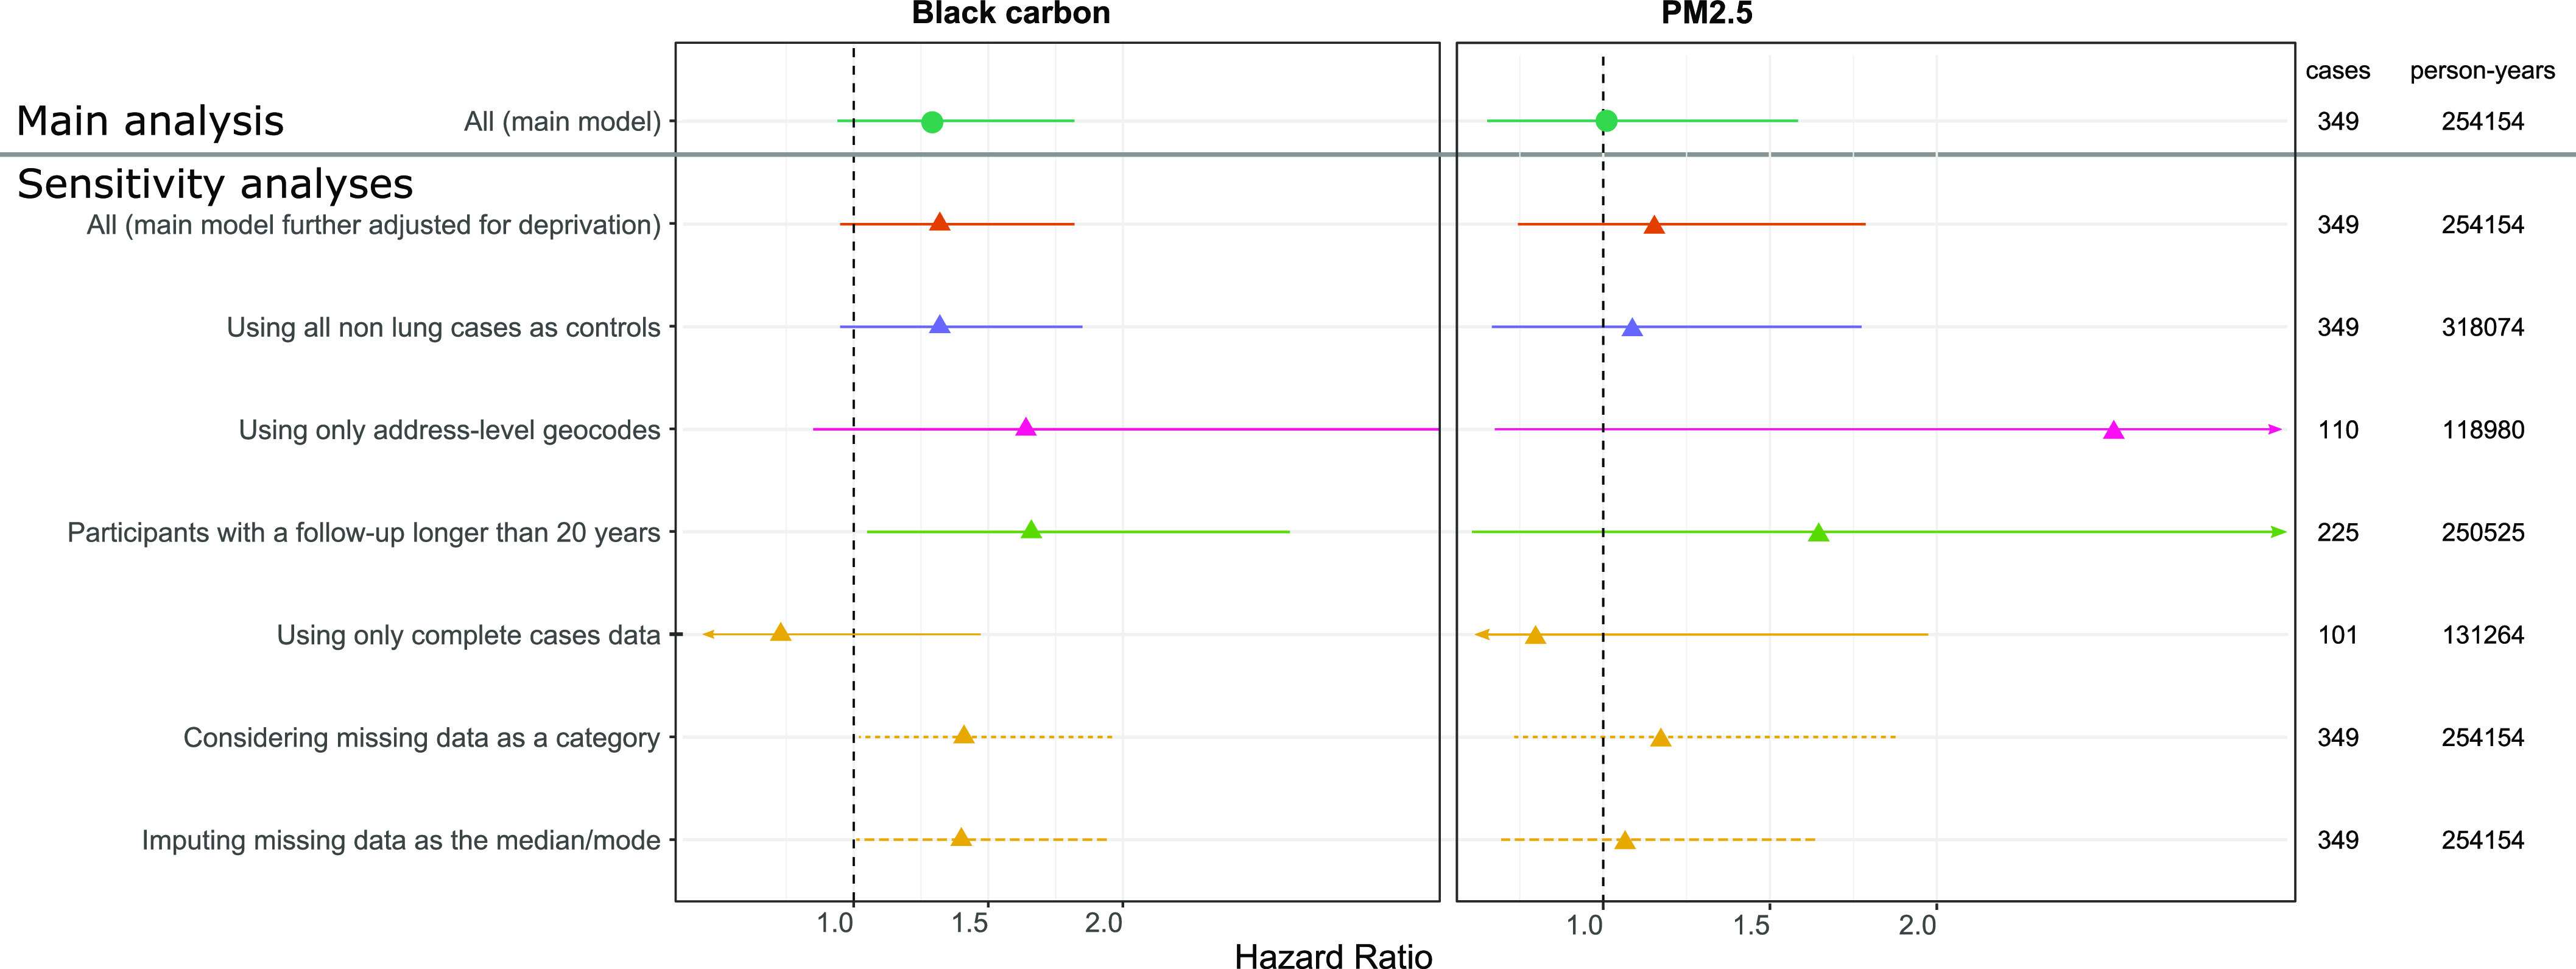
Associations between cumulative black carbon (left) and (right) and lung incident cancer in the main and sensitivity analyses in the Gazel cohort, with the number of identified cancer cases among the number of participant-year over the follow-up. Hazard ratios and confidence intervals expressed for one IQR increase in ln-transformed cumulative exposure to black carbon or in separate single-pollutant Cox model with attained age as underlying time-scale and time-dependent variables, adjusted for sex, cumulative smoking pack-years, passive smoking, alcohol use, BMI, education, socioeconomic status, family status, fruit and vegetable consumption, occupational exposure to lung carcinogens, age at inclusion and calendar time. Exposures were lagged 10 y. Participants were excluded from the analysis if they were diagnosed with cancer before 1999. See Table S5 for corresponding numeric data. Unless specified otherwise, these model-based estimates were computed using MICE to address missing data and were pooled following Rubin’s rules. Note: BMI, body mass index; IQR, interquartile range.