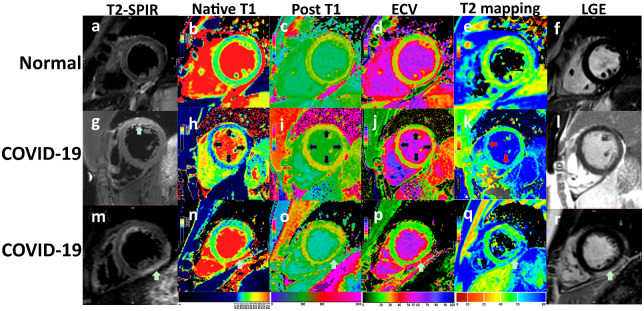
Figure 3.
Three cases of CMR measurements included T2-STIR, Native T1 mapping, Post-contrast T1 (post T1), ECV, T2 mapping, and PSIR. The upper row (A–F) represents a healthy participant. The figures in the second row are of a patient (G–L) confirmed with COVID-19 and had a slightly increased TnI (0.08 ng/mL). The anterior wall displayed transmural hyperintensity. T1, T2, and ECV also displayed diffuse hyperintensity. The global T1, T2, and ECV were higher than the normal group, although the differences of PSIR were not significant. The third patient (M–R) with COVID-19 (ECG: T-wave depression, short PR interval, TnI: 0.14 ng/mL, LDH: 302 mmol/L) displayed typical T2-STIR and LGE hyperintensity in the sub-epicardium of the left ventricular inferior and inferior-lateral wall of the basal and middle parts.

