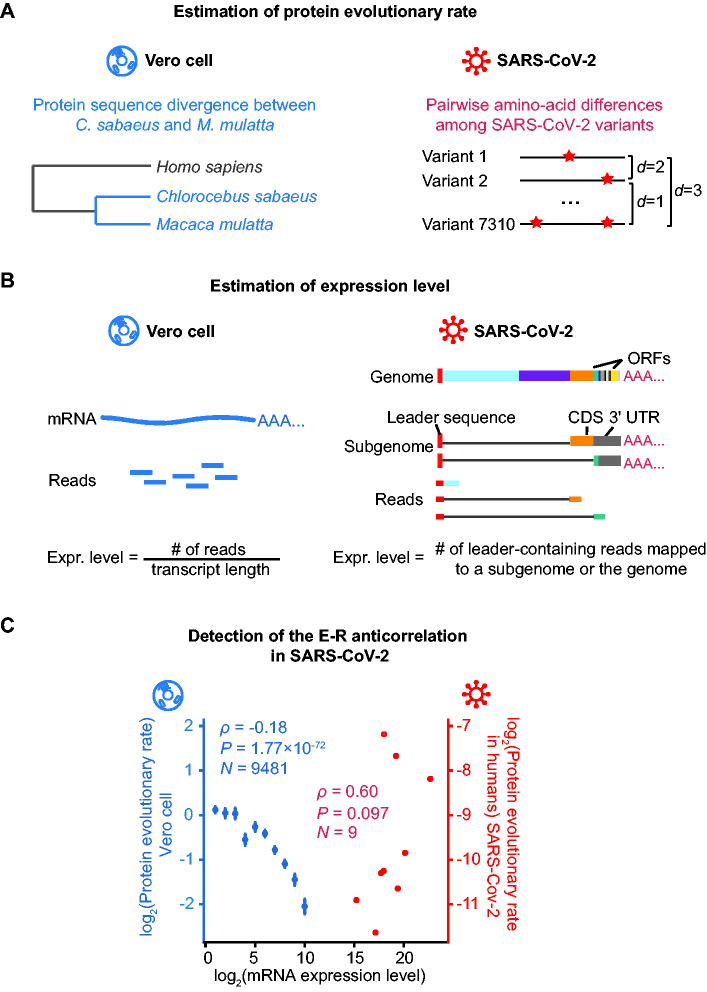
Fig. 2.
Detection of the E–R anticorrelation in SARS-CoV-2. (A) A schematic shows how the protein evolutionary rate is estimated for Vero cell and SARS-CoV-2. The red stars on the right panel denote amino acid alternations. (B) A schematic shows how expression level is estimated for Vero cell and SARS-CoV-2. On the left penal, the expression level for each Vero cell gene is estimated as the normalized reads abundance aligned to it. On the right penal, the genome and two out of the eight subgenomes of SARS-CoV-2 are shown as examples. The gray lines denote the regions skipped by the leader-to-body fusion during the discontinuous transcription in coronaviruses. Note that the coding sequence (CDS) of a subgenome could be the 3′-UTR of another subgenome. Therefore, the expression level for each ORF in SARS-CoV-2 was estimated as the number of lead-containing reads of the corresponding subgenome. (C) The E–R correlation in the Vero cell (in blue) and in SARS-CoV-2 (in red). For Vero cells, expressed protein-coding genes are split into ten bins according to their expression levels: (−∞, 0.5), [0.5, 1.5), [1.5, 2.5), [2.5, 3.5), [3.5, 4.5), [4.5, 5.5), [5.5, 6.5), [6.5, 7.5), [7.5, 8.5), [8.5, 9.5), [9.5, +∞). The mean and standard errors of evolutionary rates are shown for each bin. Spearman’s correlation coefficients were calculated from the unbinned data.

