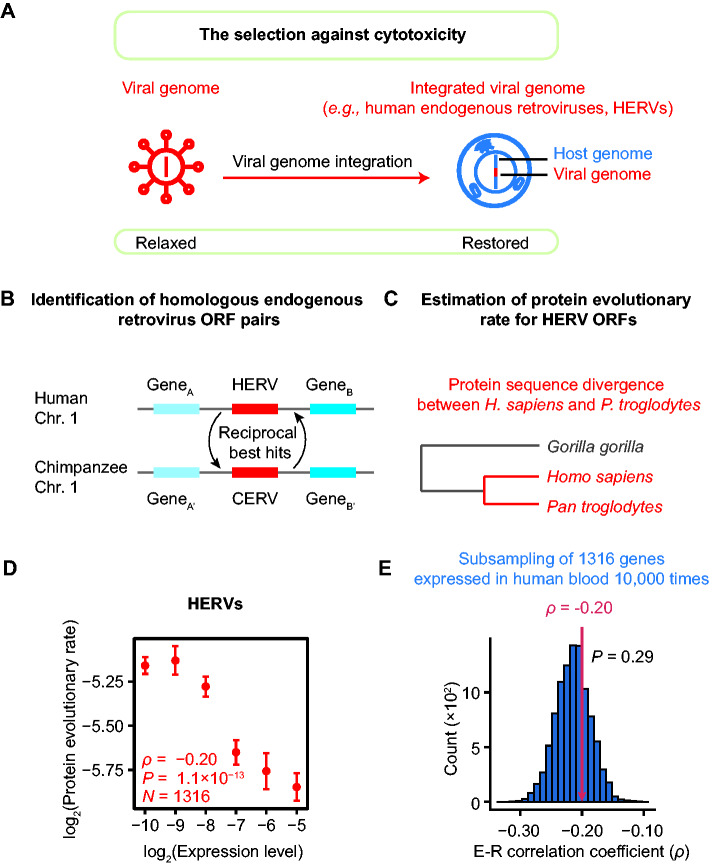
Fig. 7.
The presence of E–R anticorrelation among HERV ORFs. (A) The selection against cytotoxicity is restored when a viral genome is integrated into a host genome. (B) The syntenic reciprocal best BLAST hits endogenous retrovirus pairs were identified as human–chimpanzee orthologous pairs. (C) A schematic shows the estimation of the protein evolutionary rate for each HERV ORF. (D) The E–R correlation in HERVs (ρ = −0.20, P = 1.1 × 10⁻¹³, N = 1,316, Spearman’s correlation). The expression levels of HERV ORFs are estimated from RNA-seq data for human peripheral blood mononuclear cells from six healthy individuals. The plot shows the expression level in healthy #1 (replicate #1). Replicates #2–#6 are shown in supplementary figure S3, Supplementary Material online. The HERV ORFs are split into six bins according to their expression levels: (−∞, −9.5), [−9.5, −8.5), [−8.5, −7.5), [−7.5, −6.5), [−6.5, −5.5), and [−5.5, +∞). The mean (±standard errors) of the evolutionary rate is shown for each bin. Spearman’s correlation coefficient is calculated from the unbinned data. (E) The E–R anticorrelation among HERVs (indicated by the red arrow) was not significantly different from that among human nonvirus protein-coding genes (ρ = −0.21, P = 6.2 × 10−182, N = 17,410). The one-tailed P value (0.29) was calculated from a subsampling test. The histogram shows the distributions of 10,000 E–R correlation coefficients estimated from individual subset of 1,316 genes.

