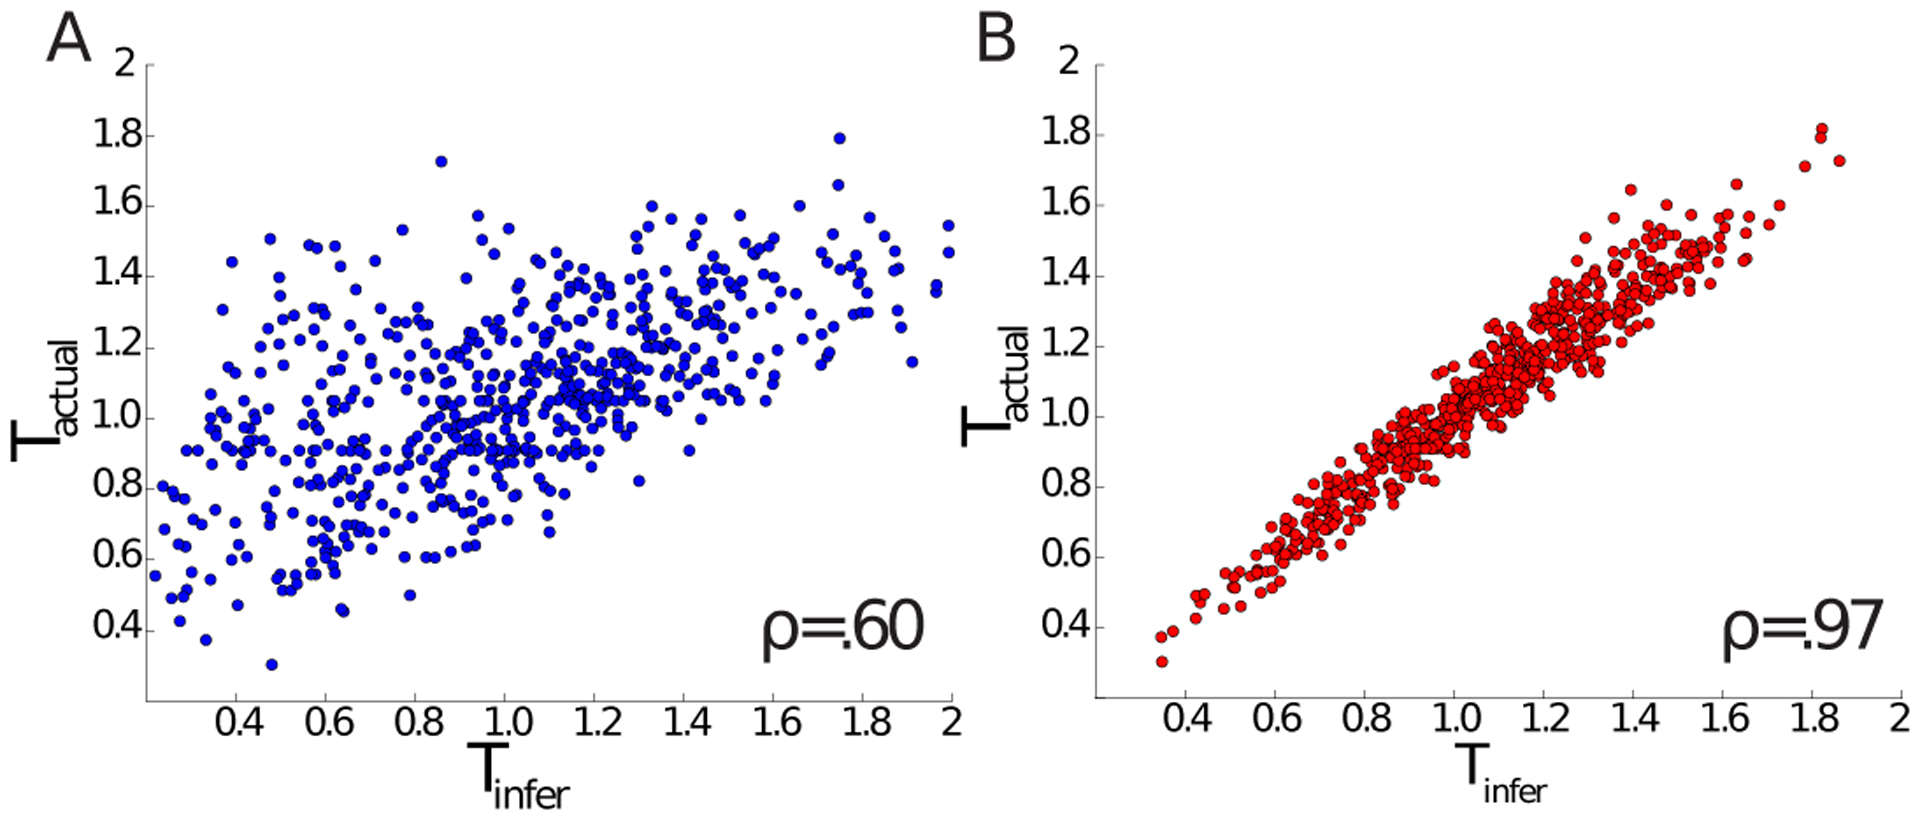
Figure 3. Validation of VMSI for force inference using synthetic data.

A) Comparison of actual and inferred tensions based on the “matrix inverse”-type inference method introduced in [29] made over-determined using measured edge curvature data, as in [33]. 10% noise was added to the synthetic input data (see Appendix D for details). ρ denotes the Pearson’s correlation coefficient. B) Same as (A) but using the VMSI on the same synthetic data. Note the significant increase of the correlation coefficient.
