
Figure 5. Balanced myosin versus total myosin.
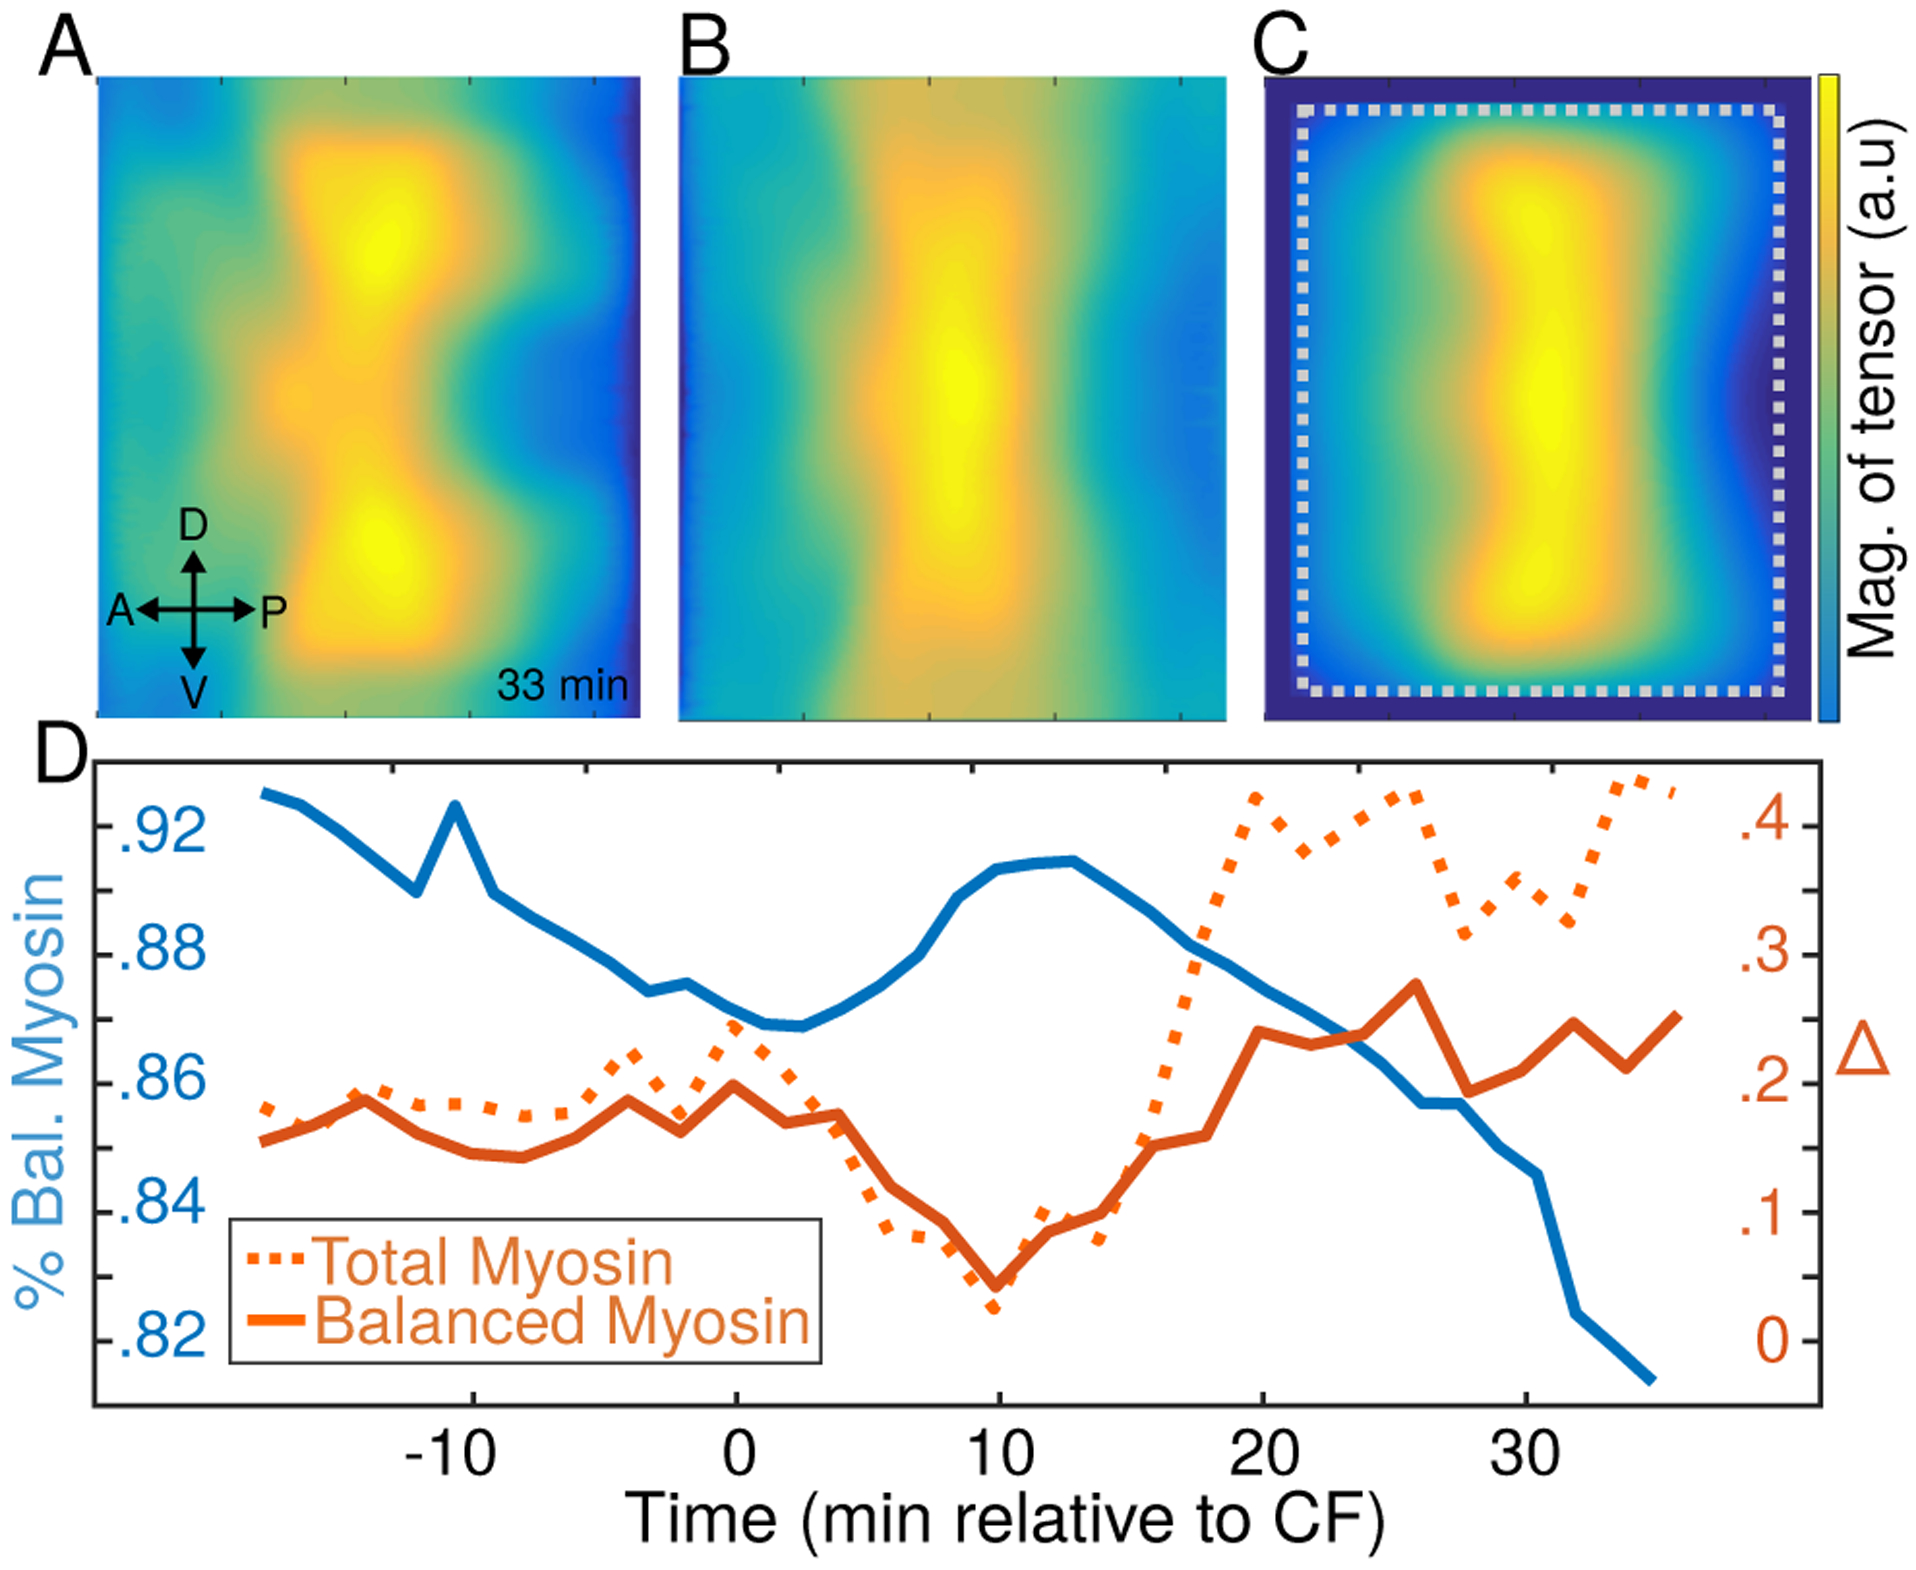
A) The magnitude of the myosin tensor measured in [34] 33 minutes after the formation of the ventral furrow. B) Same for the balanced component myosin tensor, defined by Eq. (13), at the same time. Note that the balanced myosin is approximately constant along the DV axis in contrast with the total myosin displayed in (A). C) The magnitude of the inferred stress tensor at the same time-point. Note greater similarity with (B) than with (A). The dotted gray box shows the region that was amenable to image segmentation. D) The average misalignment Eq. (10) between inferred stress and myosin tensors (balanced/total displayed as solid/dashed orange lines respectively). The balanced fraction of myosin is shown in blue. As expected, the inferred stress tensor provides a better approximation for the balanced component of myosin tensor then for the total.