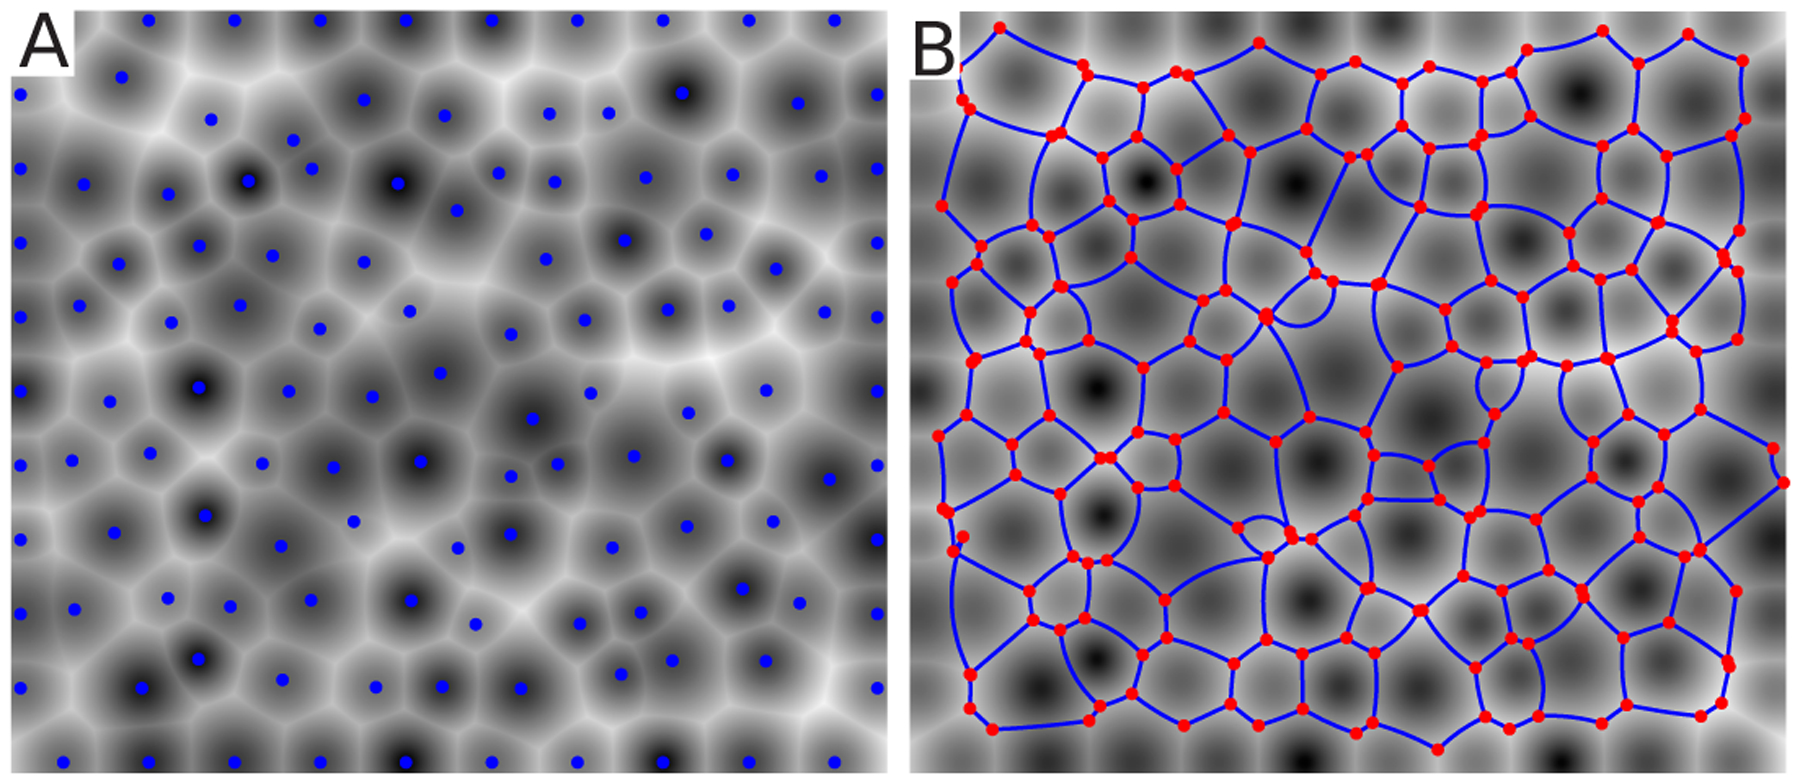
Figure A.1.

A) An example plot of the image of weighted distance from each generating point produced using MATLAB’s bwdist function and the algorithm described. The location of the generating points qα are shown as blue dots. B) The resultant CAP network. The segmentation output from MATLAB’s watershed algorithm is used to infer the triangulation topology. This is then passed into our forward equations to generate the exact positions of vertices and curvatures of edges. The result, using the original values for the generating points and the measured triangulation topology, is overlayed in blue over the original distance map.
