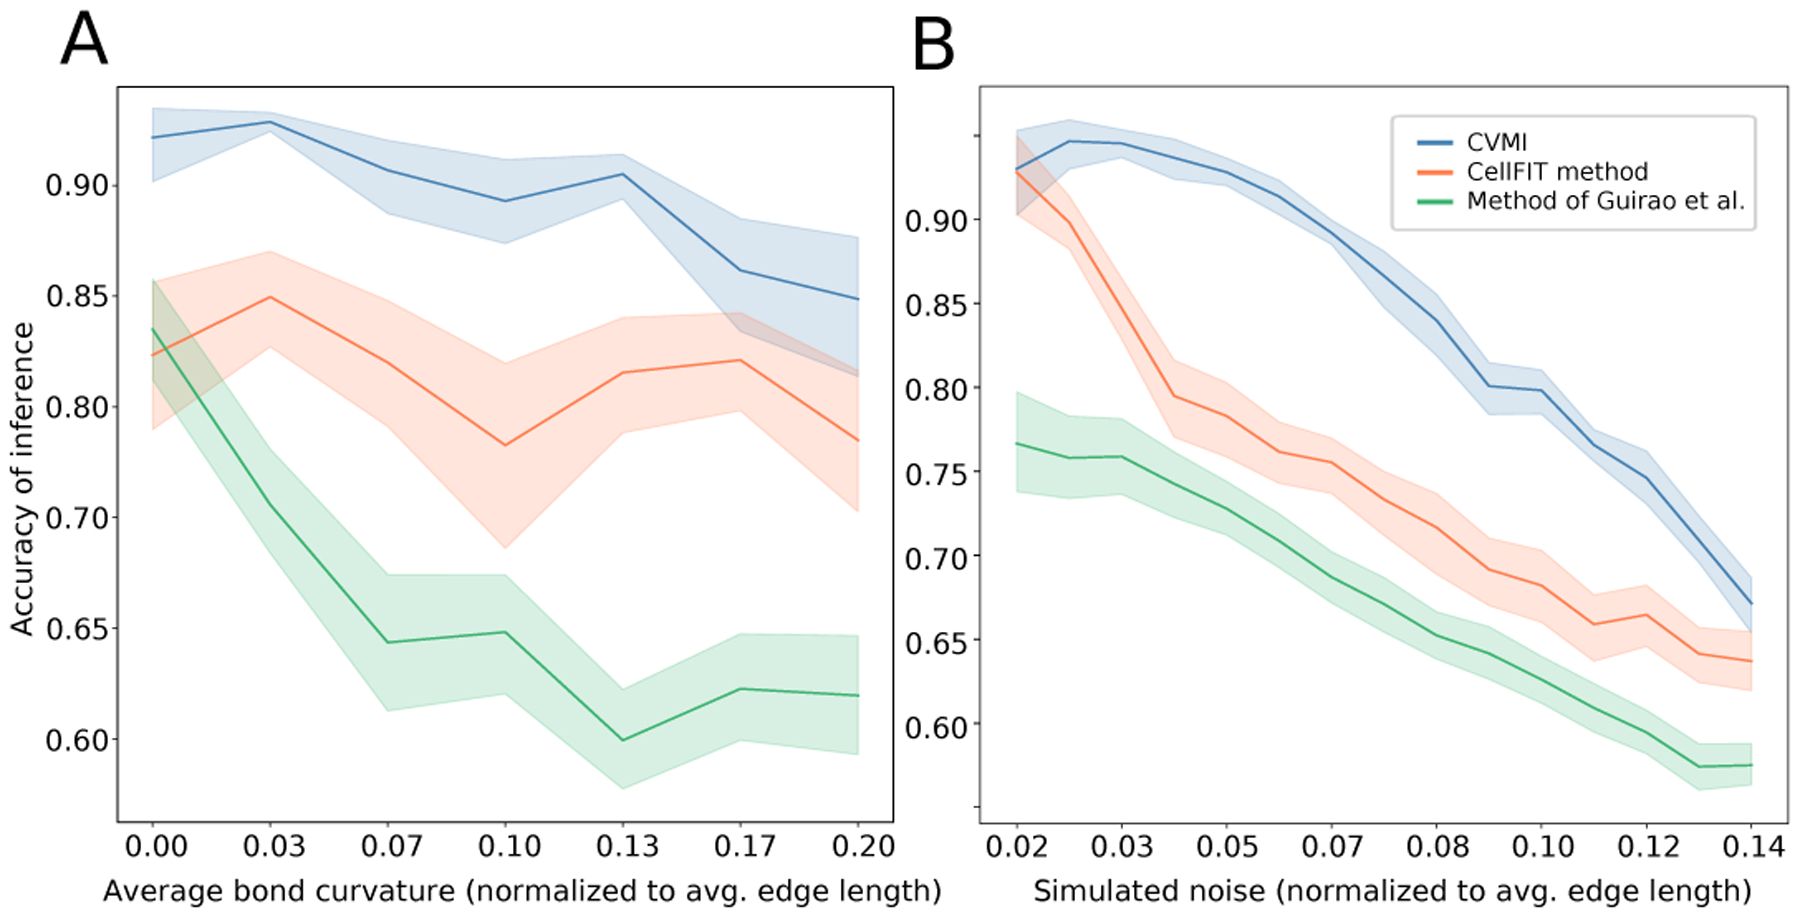
Figure A.2.

Correlation between inferred tensions and pressures against the known synthetic values for three mechanical inference schemas – (CVMI (blue), our implementation of the CellFit method [33] (orange), and the inverse used within [31] kindly provided by the authors (green) – as a function of the contribution of pressure to mechanical balance (A) and the strength of random perturbations to vertex position (B). Panel (A) represents a simulated lattices with constant noise of .03 (strength of perturbation is normalized to the average edge length). Similarly, panel (B) is taken at a finite average pressure differential of .03 (average ratio of edge length to radius of curvature). All algorithms were run on the same synthetic datasets. Each curve depicts the mean and variance of 100 networks of size 120 cells generated with equivalent parameters as described in the text.
