
Figure A.3.
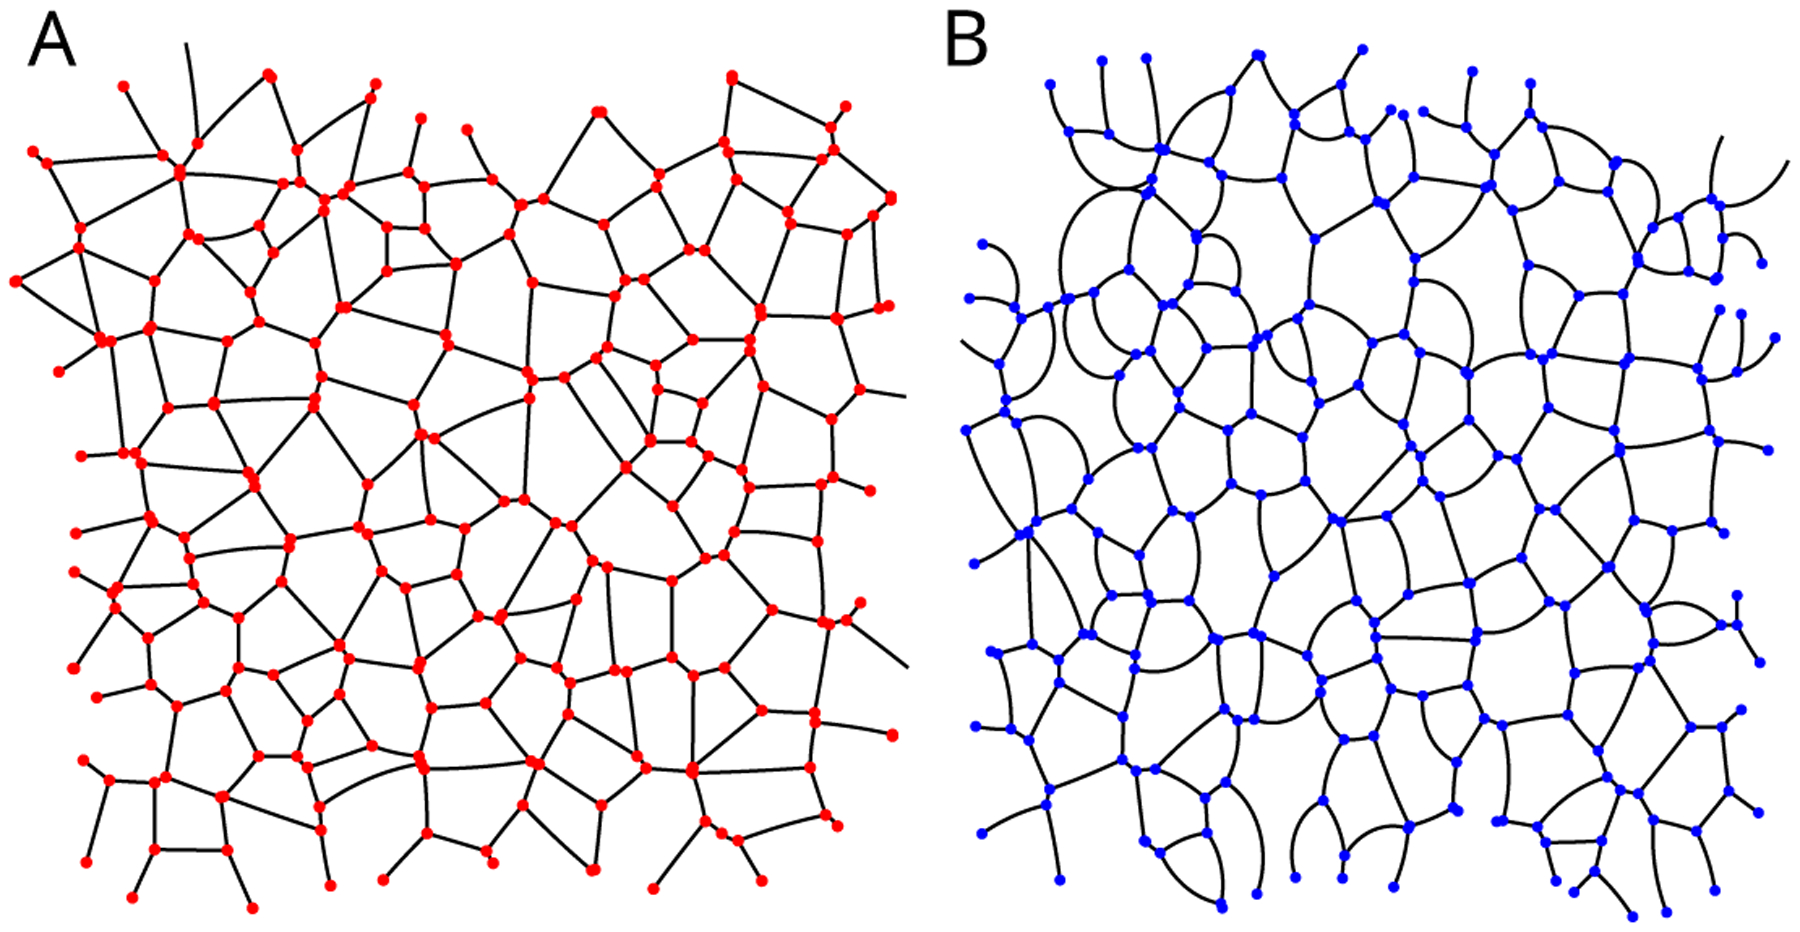
Two examples of simulated CAP networks used in the in-silico verification presented in Appendix D with varying average pressure differences. Networks (A) and (B) were generated with varying degrees of intracellular pressure differentials. The average edge curvature, normalized to edge length, - i.e. Rαβ/rαβ - for (A) and (B) are .01 and .20 respectively.