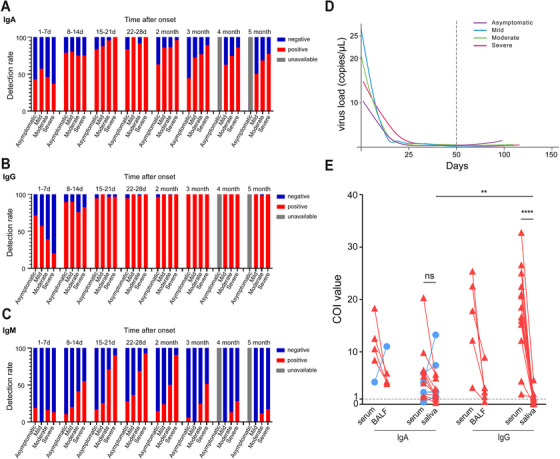
FIGURE 2.

Virus load kinetic curve and antibodies detection in COVID‐19 patients. The detection rates of IgA (A), IgG (B), and IgM (C) in different phases of the disease grouped by clinical classification are shown. Kinetic curves of SARS‐CoV‐2 virus load (D) grouped by clinical classification. IgA and IgG were detected in BALF, saliva, and corresponding serum samples (E). IgA detection was performed in five BALF samples (five of five were positive) and 15 saliva samples (13/15 were positive). IgG detection was performed in five BALF samples (four of five were positive) and 15 saliva samples (five of 15 were positive). Red triangle and blue circle depict the decrease of antibody COI and the increase compared to that in serum, respectively. Paired‐sample t‐test was used to determine the statistically significant difference in IgA or IgG levels between serum and saliva samples, and between IgA and IgG levels in saliva samples
