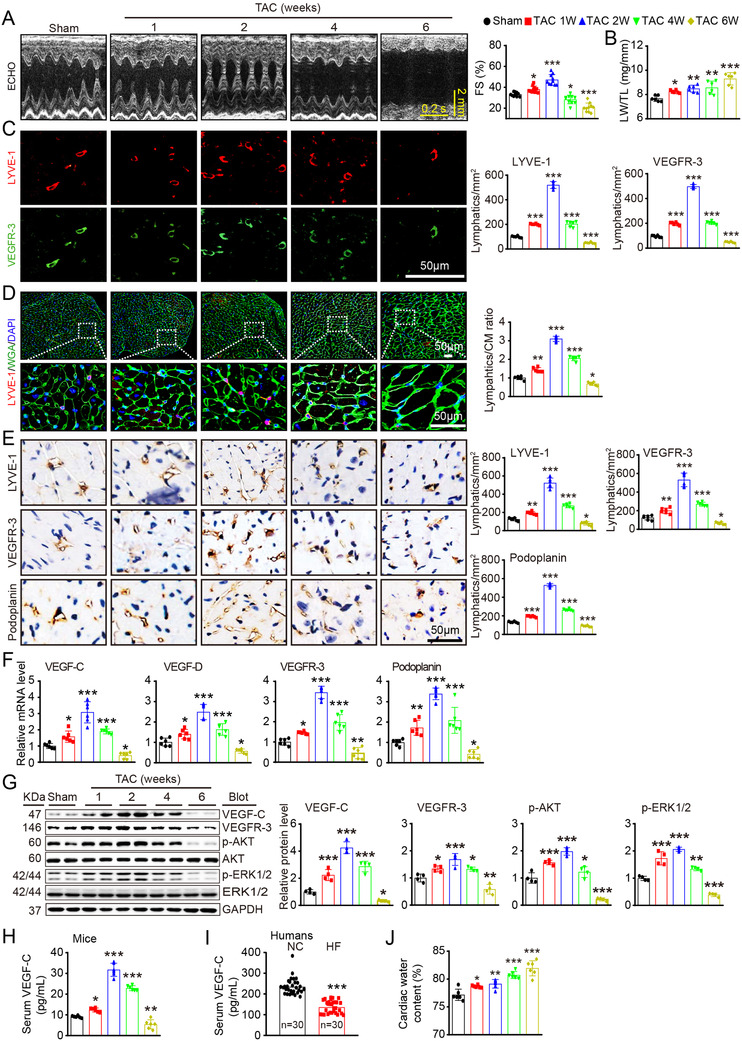
FIGURE 1.

Cardiac function, hypertrophy, and lymphangiogenesis after pressure overload. WT mice were subjected to sham or TAC surgery and remained under sham or TAC conditions for 1–6 weeks. (A) M‐mode echocardiography of the left ventricular (LV) chamber (left) and measurement of LV fraction shortening (FS%) (right, n = 10). (B) Lung weight/tibial length (LW/TL) ratio (n = 6). (C) Heart sections stained with an antibody against LYVE‐1 (red) or VEGFR‐3 (green) (left, scale bar: 50 μm) and quantification of LYVE‐1+ or VEGFR‐3+ lymphatic vessels (right, n = 6). (D) Heart sections stained with an anti‐LYVE‐1 antibody (red), tetramethylrhodamine isothiocyanate (TRITC)‐labeled wheat germ agglutinin (WGA) (green) and DAPI (blue) (left, scale bar: 50 μm) and the LYVE‐1+ vessel to cardiomyocyte (CM) ratio (right, n = 6). (E) Immunohistochemical analysis of the lymphatic markers LYVE‐1, VEGFR‐3, and Podoplanin in the heart (left, scale bar: 50 μm) and quantification of the LYVE‐1+, VEGFR‐3+, and Podoplanin+ lymphatic vessels (right, n = 6). (F) qPCR analyses of VEGF‐C, VEGF‐D, VEGFR‐3, and Podoplanin mRNA levels (n = 6). (G) Immunoblot analysis of the VEGF‐C, VEGFR‐3, p‐AKT, AKT, p‐ERK1/2, and ERK1/2 proteins in the heart (left) and quantification of these proteins (right, n = 4). GAPDH was used as an internal control. (H) ELISA assays of the serum VEGF‐C concentrations in mice after sham or TAC surgery. (I) ELISA assays of the serum VEGF‐C concentrations in patients with heart failure (HF, n = 30) and normal controls (NCs, n = 30). (J) Gravimetric assessment of the cardiac water content (%) in mice as determined by the cardiac dry weight to wet weight ratio (n = 6). The data are presented as the mean ± SD, and n represents the number of mice or patients per group. Statistical analysis was performed with one‐way ANOVA; *p < 0.05, **p < 0.01, and ***p < 0.001 versus sham or NCs
