
FIGURE 4.
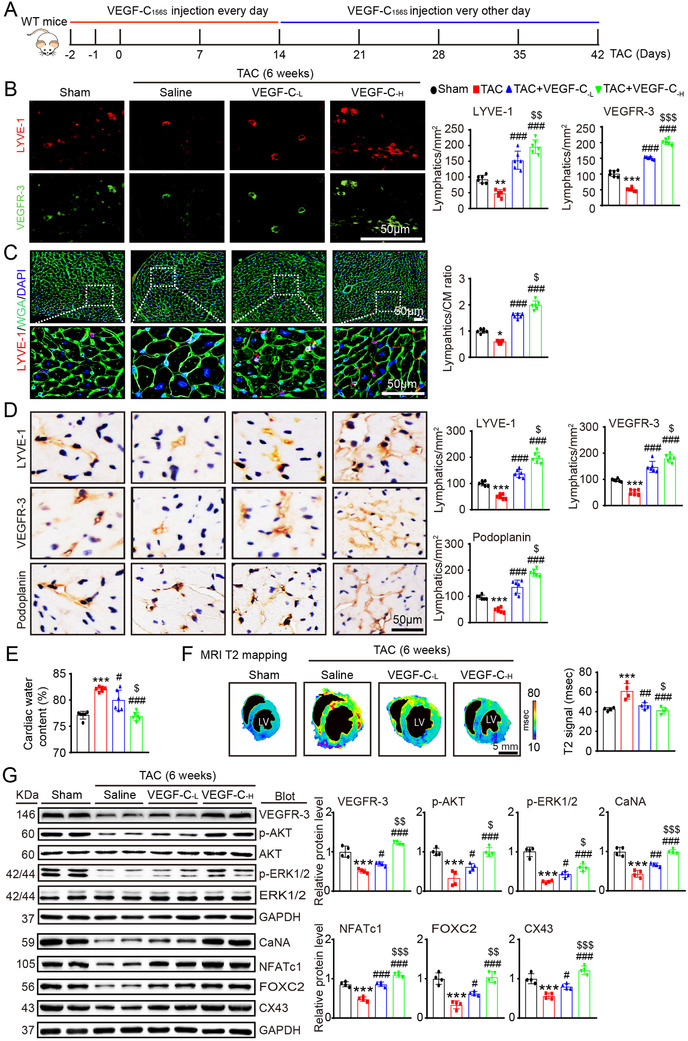
Administration of VEGF‐C156S improves cardiac lymphangiogenesis and edema after pressure overload. (A) Schematic of the methods for treatment of WT mice with saline or VEGF‐C156S at doses of 33 (VEGF‐C‐L) and 100 (VEGF‐C‐H) ng/g and TAC for 6 weeks. (B) Heart sections stained with an anti‐LYVE‐1 (red) or anti‐VEGFR‐3 antibody (green) (left, scale bar: 50 μm) and quantification of LYVE‐1+ or VEGFR‐3+ lymphatics (right, n = 6). (C) Heart sections stained with an anti‐LYVE‐1 antibody (red), TRITC‐labeled WGA (green) and DAPI (blue) (left, scale bar: 50 μm) and the LYVE‐1+ vessel to CM ratio (right, n = 6). (D) Immunohistochemical staining of heart sections with an antibody against LYVE‐1, VEGFR‐3 or Podoplanin (left, scale bar: 50 μm) and quantification of LYVE‐1+, VEGFR‐3+, and Podoplanin+ lymphatic vessels (right, n = 6). (E) Gravimetric assessment of cardiac water content (%) as determined by the cardiac dry weight to wet weight (n = 6). (F) Representative color‐coded images of cardiac MRI T2 mapping in which the turquoise/blue areas are normal tissues and the red/yellow areas exhibit cardiac edema (left) and MRI‐based quantification of cardiac water content (T2 map signal intensity, msec) (right, n = 4). (G) Immunoblot analysis of the VEGFR‐3, p‐AKT, AKT, p‐ERK1/2, ERK1/2, CaNA, NFATc1, FOX2C, and CX43 proteins in the heart (left) and quantification of these proteins (right, n = 4). GAPDH was used as an internal control. The data are presented as the mean ± SD, and n represents the number of animals per group. Statistical analysis was performed with one‐way ANOVA; *p < 0.05, **p < 0.01, and ***p < 0.001 versus sham; # p < 0.05, ## p < 0.01, and ### p < 0.001 versus TAC + saline; $ p < 0.05, $$ p < 0.01, and $$$ p < 0.001 versus TAC + VEGF‐C‐L