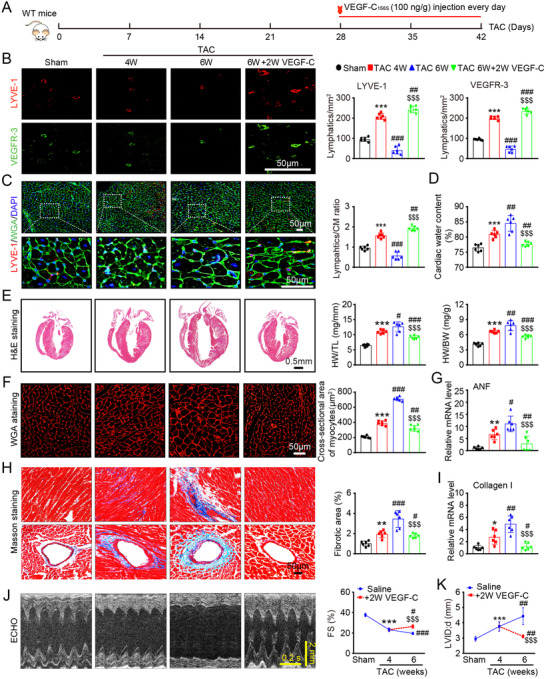
FIGURE 8.

VEGF‐C156S reverses established cardiac hypertrophy and dysfunction. (A) Schematic of the methods for treatment of WT mice that were subjected to TAC for 4 weeks and then administered saline or VEGF‐C156S (100 ng/g daily per animal) and kept under TAC conditions for an additional 2 weeks. (B) Heart sections stained with an anti‐LYVE‐1 (red) or anti‐VEGFR‐3 antibody (green) (left, scale bar: 50 μm) and quantification of LYVE‐1+ or VEGFR‐3+ lymphatics (right, n = 6). (C) Heart sections stained with an anti‐LYVE‐1 antibody (red), TRITC‐labeled WGA (green), and DAPI (blue) (left, scale bar: 50 μm) and the LYVE‐1+ vessel to CM ratio (right, n = 6). (D) Gravimetric measurement of cardiac water content (%) (n = 6). (E) H&E staining of heart sections (left, scale bar: 0.5 mm) and HW/BW and HW/TL ratios (right, n = 6). (F) Representative images of TRITC‐labeled WGA staining of CMs (left, scale bar: 50 μm) and quantification of the myocyte cross‐sectional area (right, n = 6, 200 cells counted per heart). (G) qPCR analyses of ANF mRNA level (n = 6). (H) Masson's trichrome staining of heart sections (left) and quantification of the fibrotic area (right, n = 6). Scale bar: 50 μm. (I) qPCR analyses of collagen I mRNA level (n = 6). (J) Echocardiographic assessment of the LV chamber (left) and FS% (right, n = 10). (K) Measurement of the LVID (n = 10). The data are presented as the mean ± SD, and n represents the number of animals per group. Statistical analysis was performed with one‐way ANOVA; *p < 0.05, **p < 0.01, and ***p < 0.001 versus sham; # p < 0.05, ## p < 0.01, and ### p < 0.001 versus TAC 4 week; $$$ p < 0.001 versus TAC 6 week
