
Fig. 5. Locations of the electrocortical clusters.
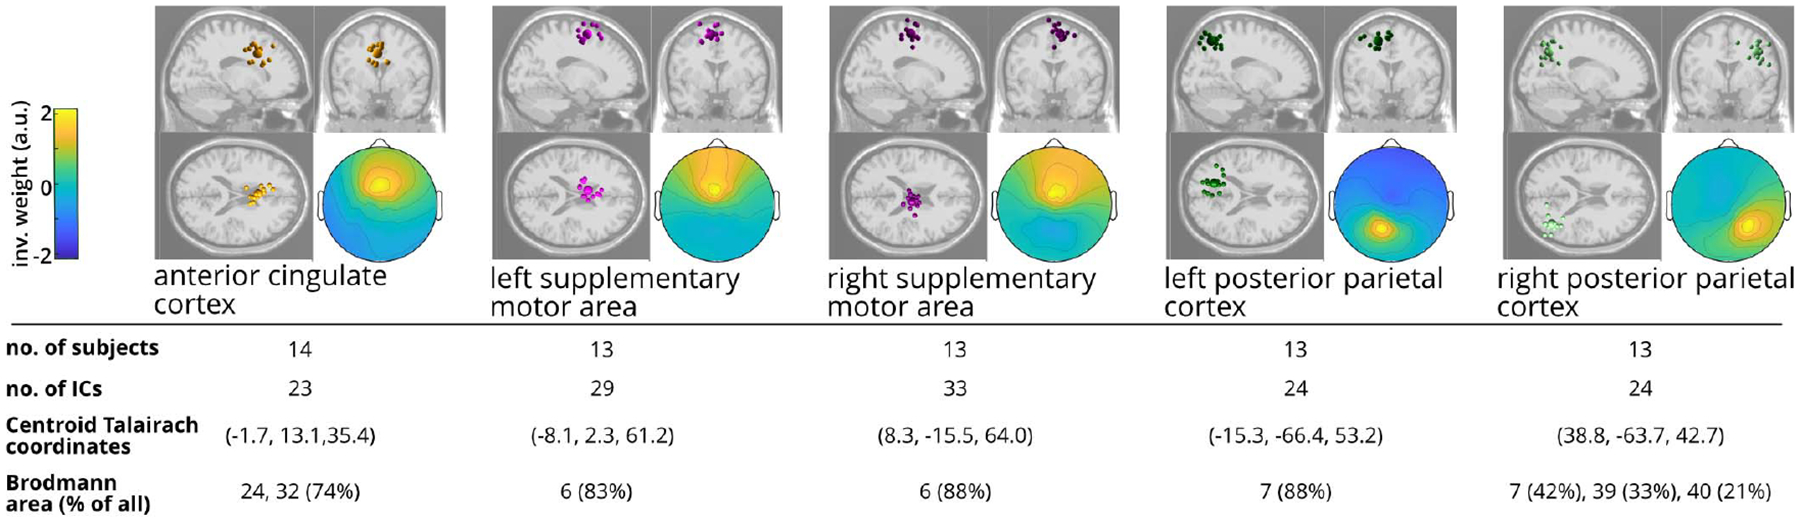
Clusters with sources from > 70% of the subjects are shown. Only one source per subject was selected for each cluster during analysis. “% of all” indicates the percentage of all components in the Brodmann Area. a.u.: arbitrary unit.