
FIGURE 3.
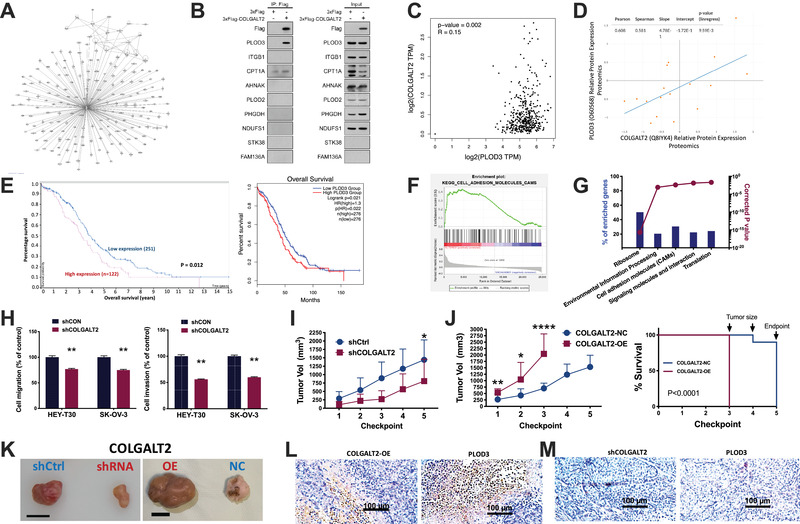
COLGALT2 interacts with PLOD3. (A) Mass spectrometry showing protein interacting with COLGALT2 in SK‐OV‐3 cells with COLGALT2‐OE, and (B) co‐immunoprecipitation of proteins of interest; (C) reproduced from TCGA fire hose legacy OvCa dataset, shown are correlation between mRNA expressions of COLGALT2 and PLOD3; (D) reproduction using DepMap showing correlation between mRNA expressions of COLGALT2 and PLOD3 in OvCa cell lines; reproduction using Human Protein Atlas of TCGA OvCa dataset shown are (E) overall survival in patients with higher or lower PLOD3 expression either by automatically designated cutoff by Human Protein Atlas, or by 35% of upper or lower PLOD3 expression, and gene expression enrichment and functional annotation using (F) GSEA and (G) NET‐GE; (H) transwell assays showing cell migration and invasion of OvCa cells with shCOLGAL2 and control; xenograft mouse model using SK‐OV‐3 cells with COLGALT2 knockdown (sh) or overexpression (OE) and control (N = 10 in each group) showing tumor size monitoring at each checkpoint (4 days) in (I) COLGALT2 knockdown group and in (J) COLGALT2 OE group, in which mice were sacrificed at third checkpoint date due to tumors reaching cutoff size of 2000 mm3, thus generating a Kaplan–Meier curve compared using log‐rank test; all xenograft tumors extracted showing (K) representative size comparison at endpoint (error bar = 1 cm) and representative immunohistochemical staining of COLGALT2 and PLOD3 in the same sample in (L) overexpression group (error bar = 100 μm) and (M) knockdown group (error bar = 100 μm) (*p < .05; **p < .01; ***p < .001; ****p < .0001)