
Figure 4. The cGAS-STING axis promotes expression of ISGs due to loss of pol ζ function.
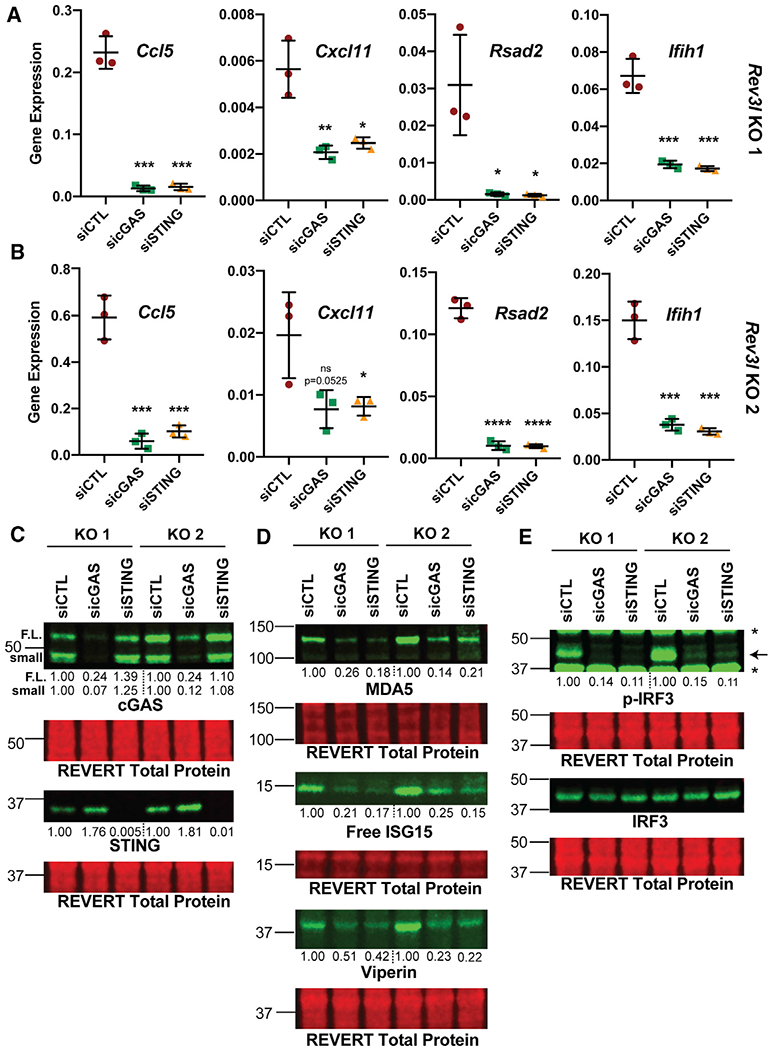
(A) Knockdown of cGAS or STING reduces mRNA expression of CCL5, CXCL11, RSAD2 (which encodes viperin), and IFIH1 (which encodes MDA5) as detected by qRT-PCR in Rev3l KO 1. Gene expression (2−ΔCt) of selected ISGs normalized to HPRT detected by qRT-PCR. Error bars represent standard deviation. Unpaired 2-tailed Student’s t test, *p < 0.05, **p < 0.01, ***p < 0.001, and ****p < 0.0001.
(B) Same as in (A), except with Rev3l KO 2.
(C) Efficient knockdown of cGAS or STING protein levels. The relative quantification of the full-length cGAS (F.L.), a cGAS smaller species (small), and STING are displayed underneath each blot. The signal intensities were first normalized to total protein.
(D) MDA5, ISG15, and viperin protein levels decrease with cGAS and STING knockdown. The quantification of each protein relative to negative control dicer-substrate short interfering RNA duplex (siCTL) is shown underneath the blot. The signal intensities were first normalized to total protein signal.
(E) Phosphorylation of S888 in mouse (analogous to the human S396) of IRF3 in Rev3l KO MEFs decreases with knockdown of cGAS and STING. The relative quantification of p-IRF3 signal intensity-normalized IRF3 is displayed underneath the p-IRF3 blot. The signal intensities were first normalized to total protein signal.