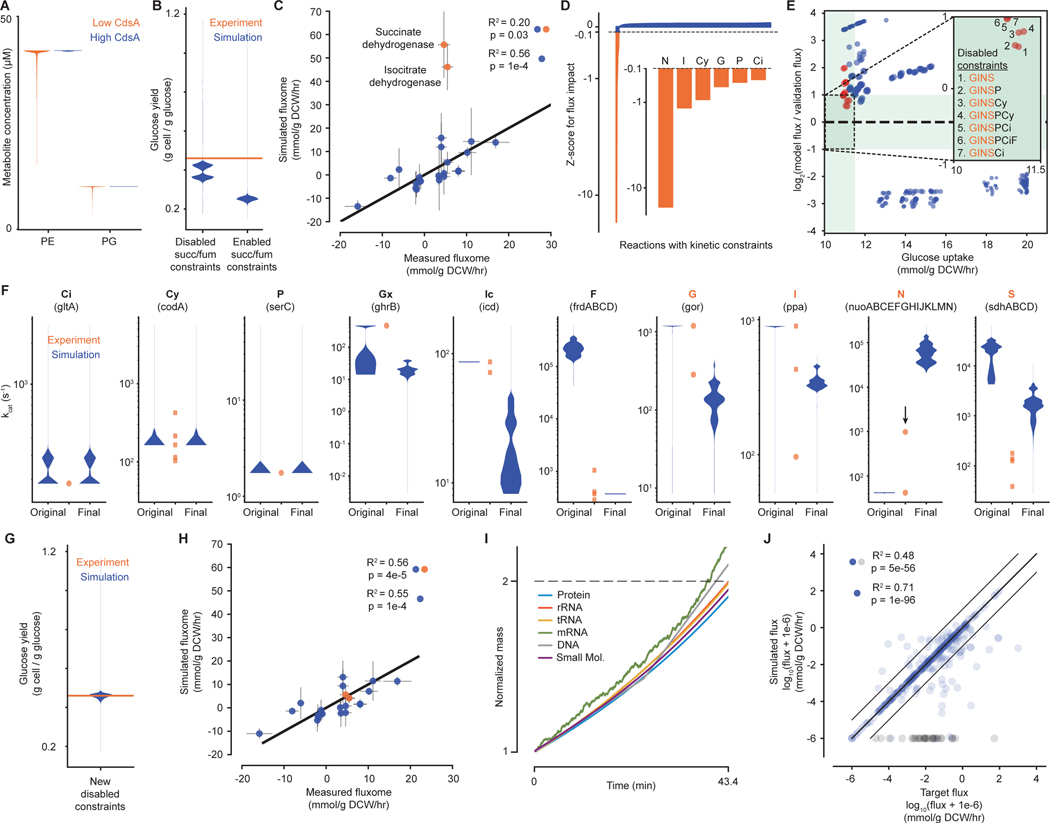
Fig. 3. Evaluating metabolic parameter values against each other and in the context of cellular growth.
(A) Violin plot of concentrations at each simulation time point for downstream metabolites of the reaction catalyzed by CdsA – phosphatidylethanolamine (PE) and phosphatidylglycerol (PG) – when the concentration of CdsA is low (orange – original, short protein half-life) or high (blue – new, longer protein half-life, see main text). (B) Violin plot for glucose yield at each simulation time point for simulations with succinate dehydrogenase and fumarate reductase kinetics constraints disabled or enabled. Experimental value is 0.46 g cell / g glucose at μ=0.900 hr−1 (52). (C) Comparison of the average fluxes from simulations with succinate dehydrogenase and fumarate reductase constraints disabled for a set of reactions in central carbon metabolism with experimental measurements (34). Orange points indicate outlier fluxes, which are discussed in more detail in the text. Correlation is shown for all data points (blue and orange) and when excluding outliers (blue). (D) Impact of individually disabling each kinetic reaction constraint on the succinate dehydrogenase flux in simulations, shown as a z-score representing the average change in flux for removing one constraint compared to the distribution of the average change in flux for removing each constraint. Constraints that have a z-score of <−0.1 are highlighted in orange and shown in more detail. Highlighted reaction constraints are part of the reactions that are further explored in E (abbreviations are listed below in F). (E) Comparison of average metrics for simulations from a two-level full factorial design to test the effects of removing up to eight kinetic constraints of interest. Inset shows the target region where the simulated glucose uptake rate is close to the expected glucose uptake rate and simulation succinate dehydrogenase flux is within a factor of 2 of the experimental flux (green region). Disabled constraint combinations are enumerated for each point in the target region. Orange points indicate simulations run with combinations of disabled constraints that included G, I, N and S; blue points indicate simulations run with at least one of these constraints enabled. (F) Distributions of predicted kcat value at each simulation time step (blue) and curated kinetic parameters (orange) for each reaction identified – citrate synthase (Ci), cytosine deaminase (Cy), phosphoserine aminotransaminase (P), glyoxylate reductase (Gx), isocitrate dehydrogenase (Ic), fumarate reductase (F), glutathione reductase (G), inorganic pyrophosphatase (I), NADH dehydrogenase (N),and succinate dehydrogenase (S). Original is from simulations without constraints for S and F; final is from simulations without constraints for Gx, Ic, G, I, N, and S. The black arrow for N indicates a newly curated kcat parameter that was not used in the model. (G and H) Similar to (B and C), but based on data from simulations with the new set of disabled constraints. (I) Representative output from simulations with the new set of disabled constraints, showing the increase in mass (normalized to initial mass and over a single life cycle) of six key cellular mass fractions. (J) Comparison between the metabolic fluxes calculated directly from the kinetic parameters (target) and the fluxes computed by simulations with the new set of disabled constraints, as summarized by the R2 value. Gray points correspond to reactions with no simulated flux despite having a target flux. Correlations are shown for all data points (blue and gray) and with gray points excluded (blue only). Full details of the analysis required to generate this figure, as well as a pointer to the generating code, can be found in the Supplement, Section 1.2.

