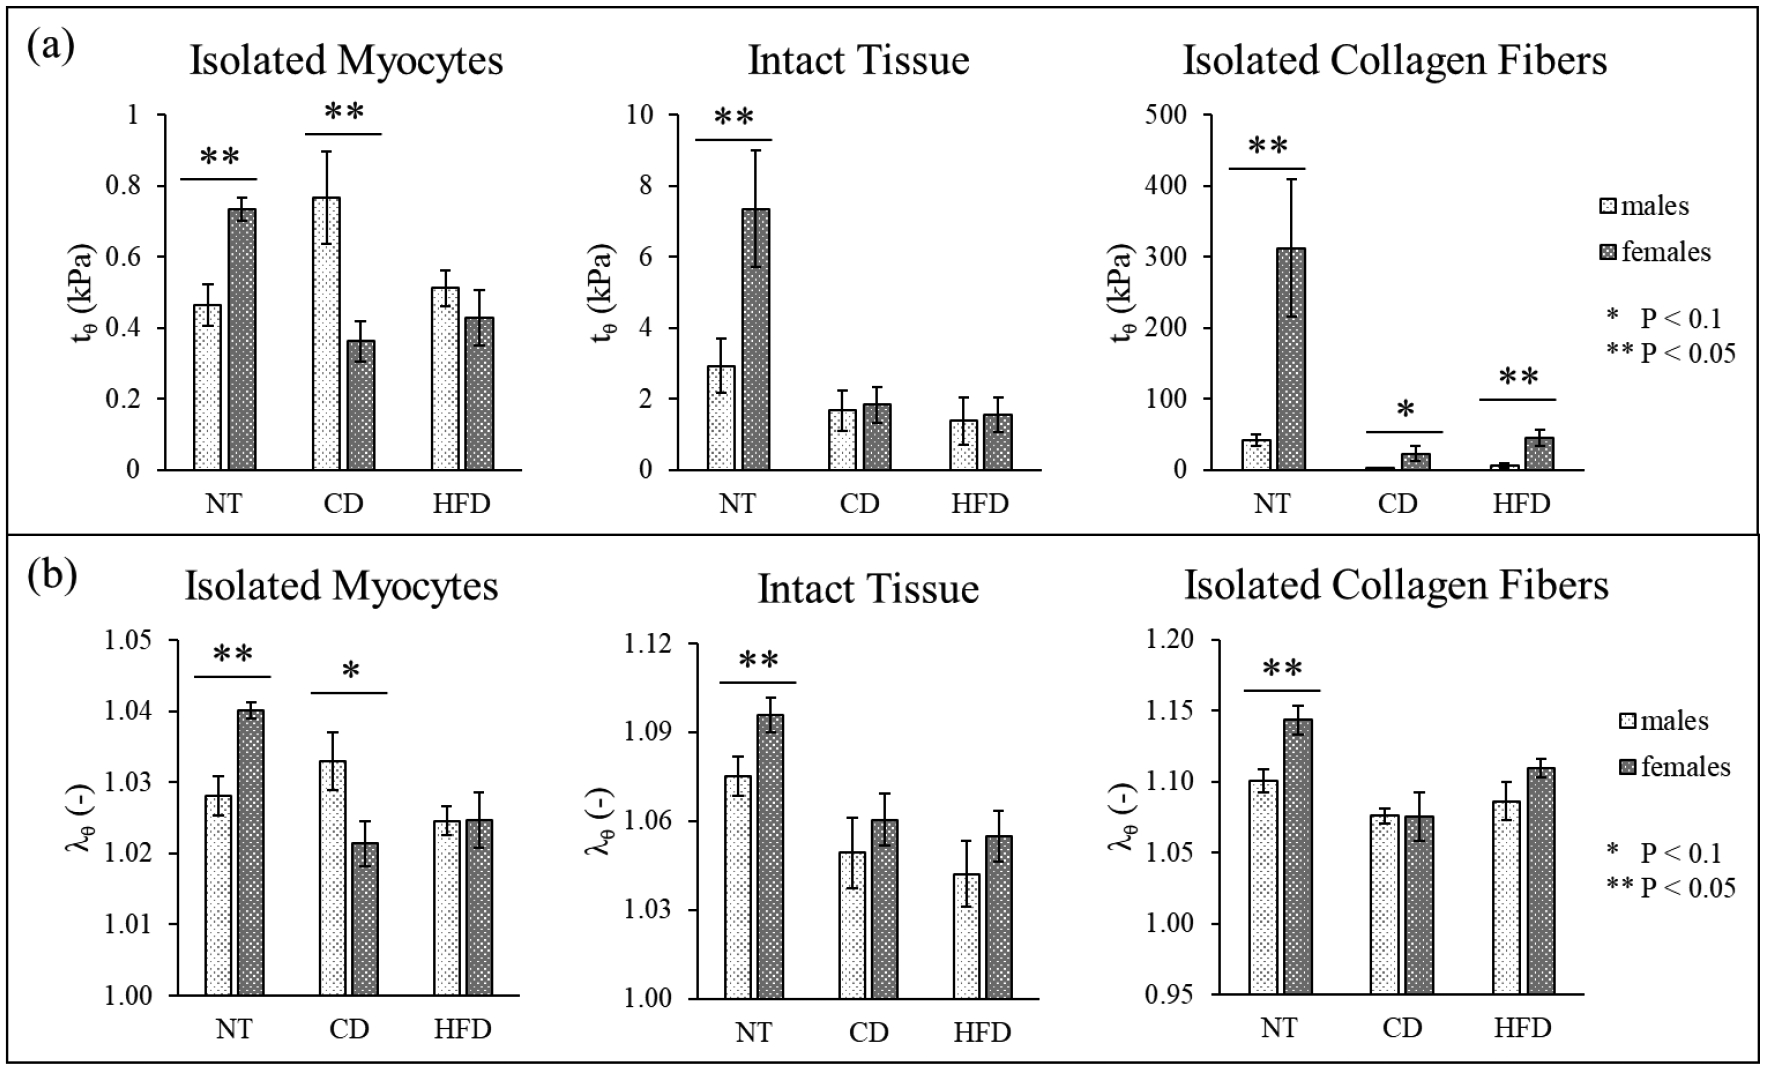
Figure 7.

Comparison between sex of the animal, including data for NT, of the maximum value of (a) circumferential residual stress (tθ, as identified in Figure 2) and (b) circumferential stretch (λθ) for all samples (mean ± standard error, note: the graphs have different vertical axes).
