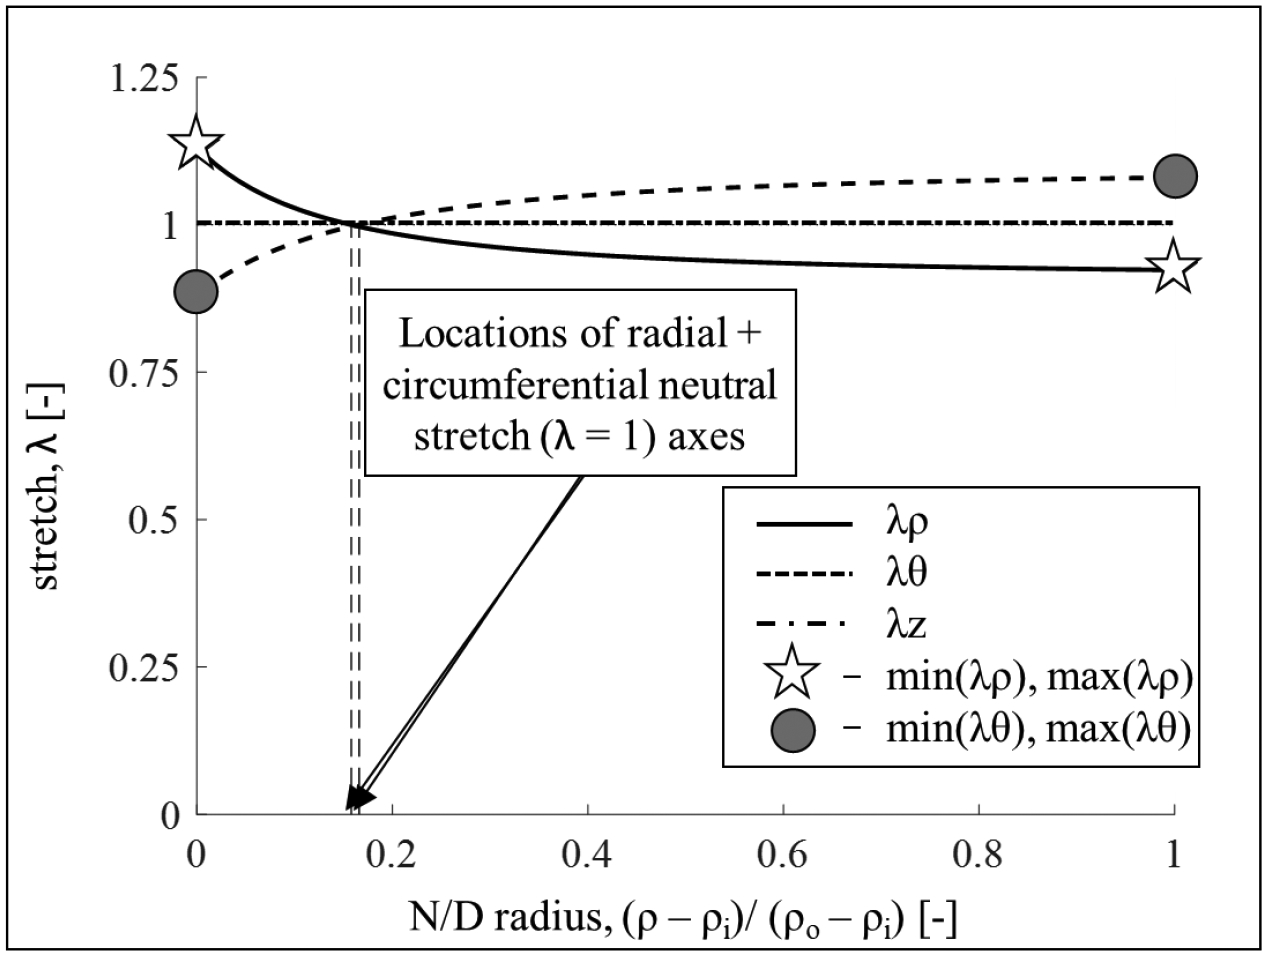
Figure B1.

Transmural residual stretch distribution for one representative sample. Radial stretch (solid line), circumferential stretch (dashed line), and axial stretch (dashed dotted line). For each sample, after evaluating the principal stretches distribution, as shown, we identified values of interest to compare across groups. Specifically, we calculated the minimum and maximum values of the radial and circumferential stretches. Note: while the axial stretch assumes in most cases values close to 1, no plain strain assumption was made.
