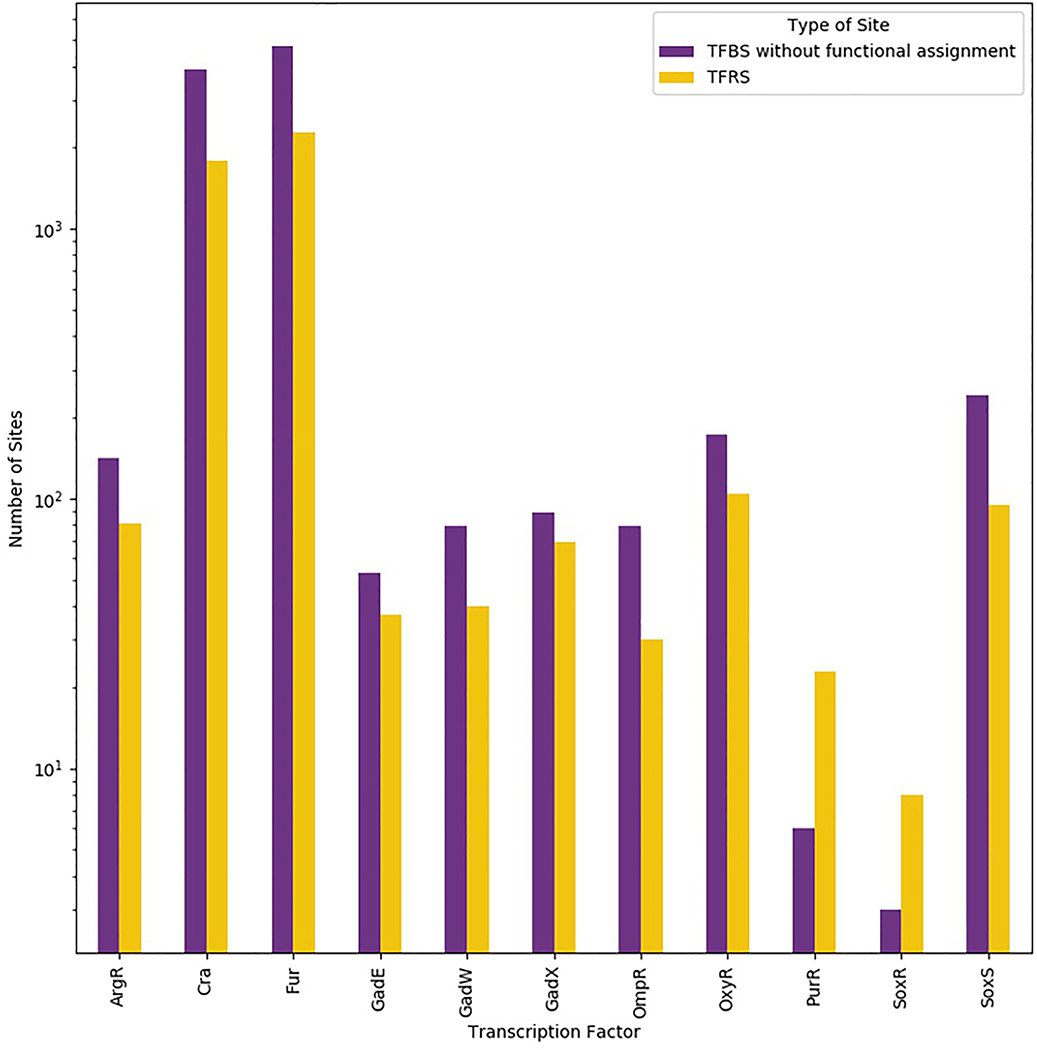
Figure 3 |. Number of transcription factor binding sites without functional assignment versus number of transcription factor regulatory sites in E. coli.
The sum of transcription factor binding sites (TFBSs) without functional assignment (purple) and transcription factor regulatory sites (TFRSs; yellow) represent the complete set of TFBSs. The figure was drawn using data from published chromatin immunoprecipitation (ChIP) experiments and data from classical experiments128,212–220. Only TFs with non-functional sites found by highthroughput methodologies were included. A logarithmic scale is used to help visualize the disparate numbers of sites known for Fur and Cra and other TFs, such as DpiA and TrpR.

