
Fig. 2.
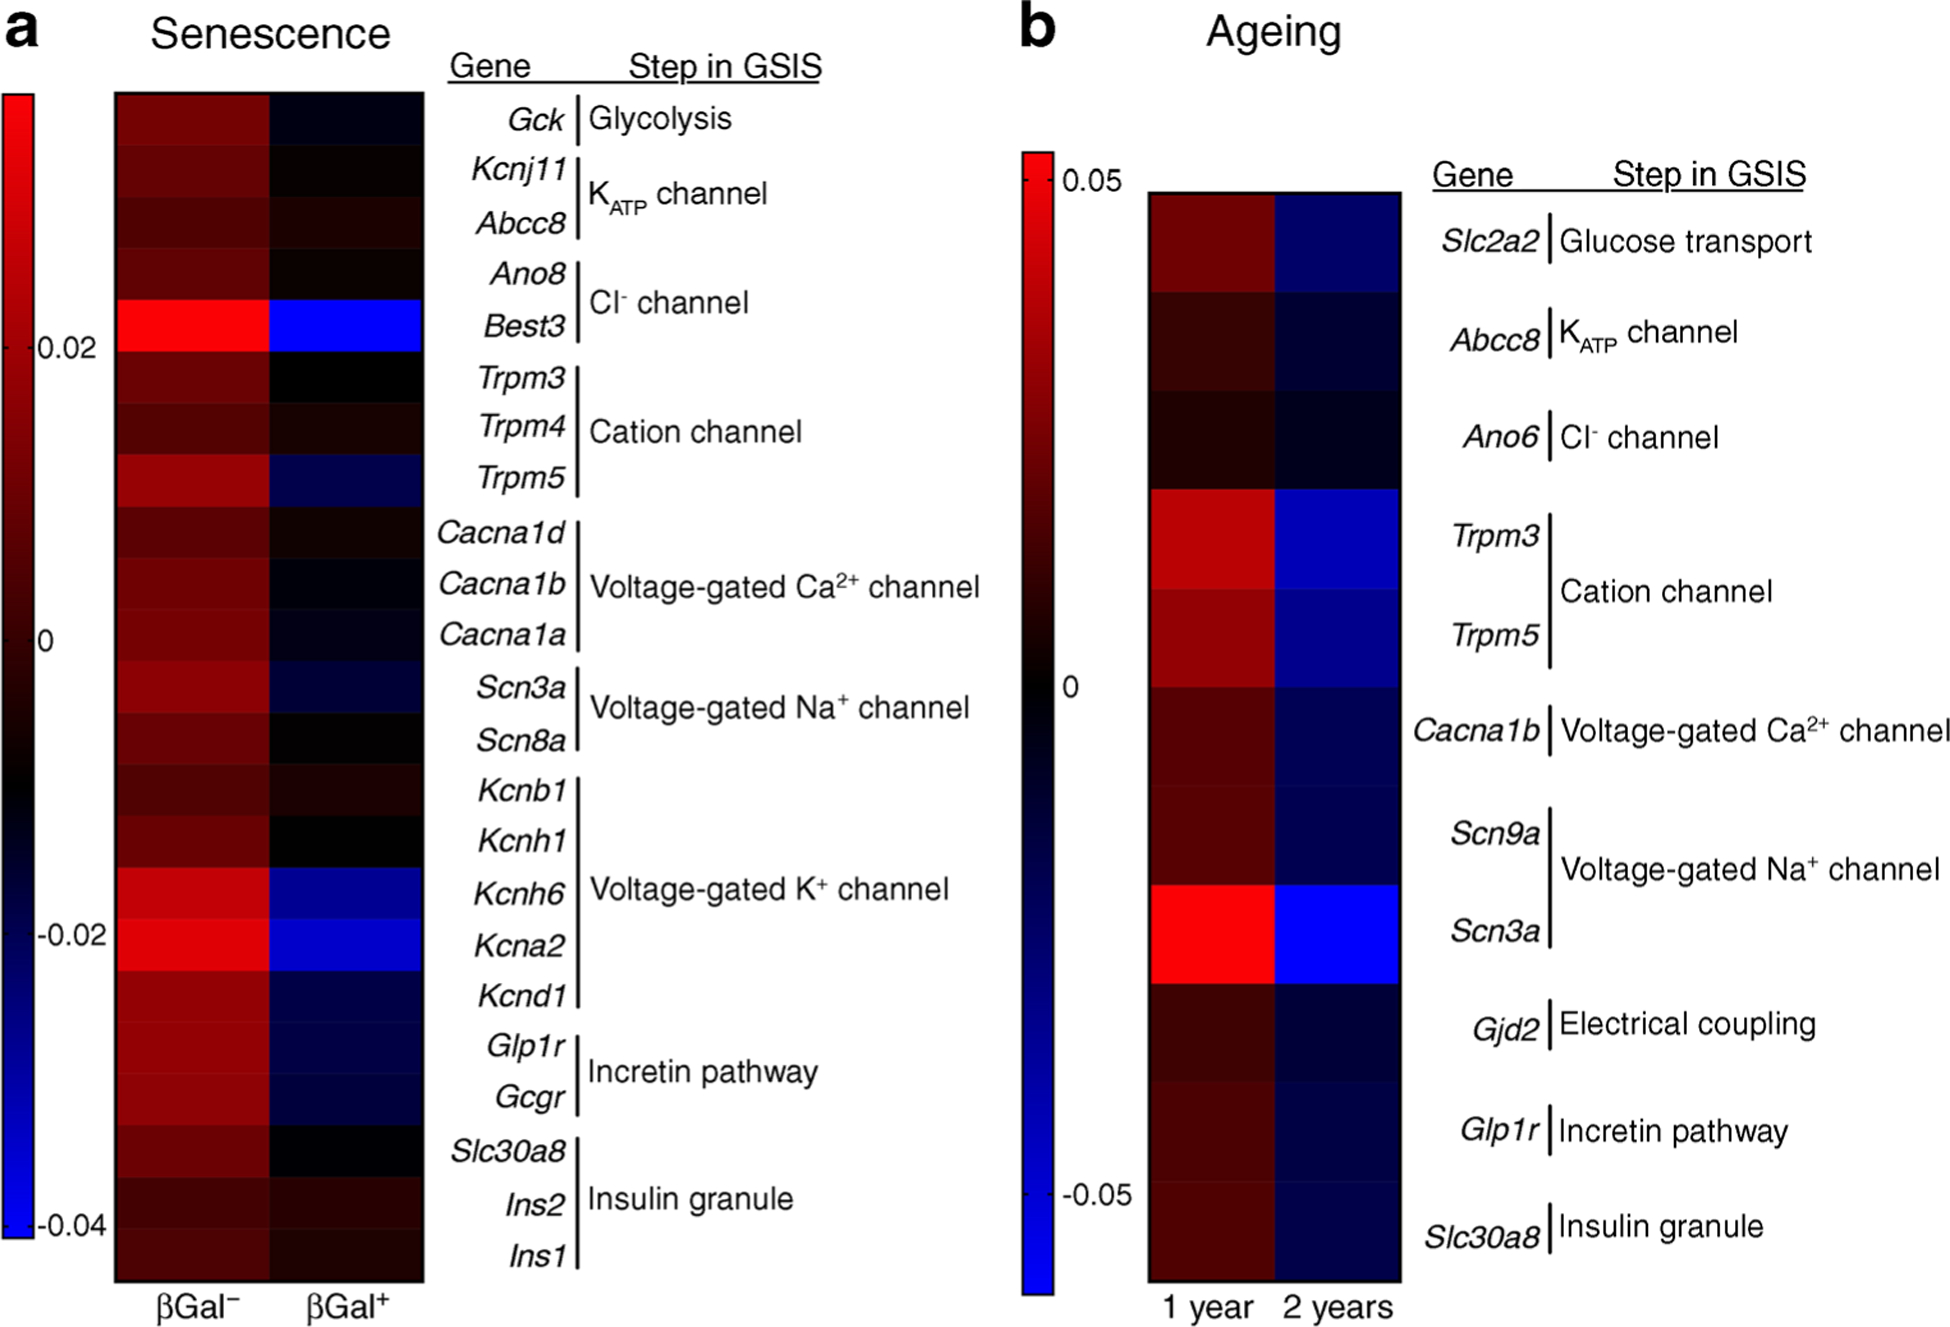
Beta cell gene expression changes due to senescence and chronological ageing are similar and reveal downregulation of key players in the stimulus–secretion coupling mechanism. (a) Islets isolated from 7–8-month-old C56Bl/6 J mice were FACS sorted into non-senescent (βGal−) and senescent (βGal+) for RNA-Seq; Mean expression is shown for n = 7 sets of paired samples. Data reported in this panel have been deposited in NCBI Gene Expression Omnibus (GEO accession number GSE121539) [2]. (b) Microarray data of purified beta cells of MIP-GFP mice 1 and 2 years of age. Mean expression is shown for n = 4 for 1 year of age, n = 3 for 2 years of age. Data reported in this panel have been deposited in the NCBI GEO database under accession number GSE72753 [16].