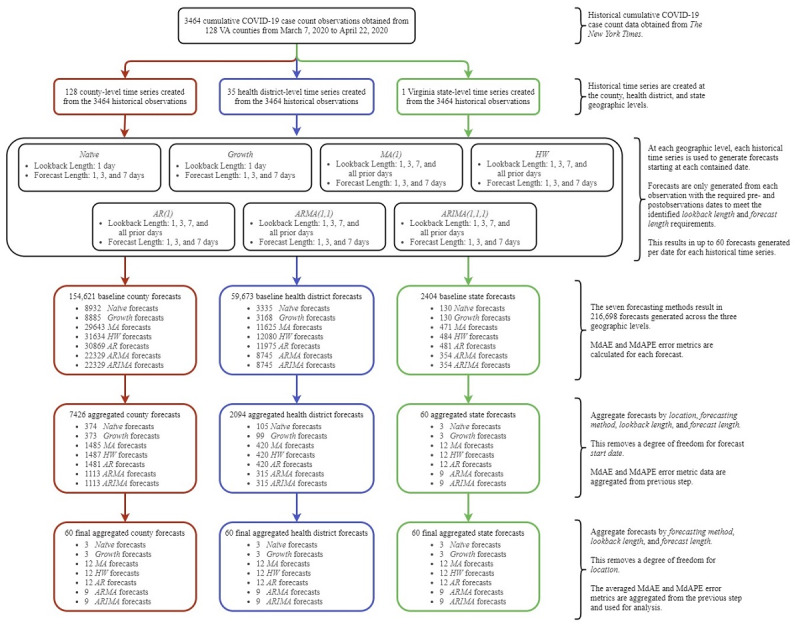
Figure 1.

Experimental design and data overview at the county, health district, and state levels. The generation and aggregation of county-level forecasts are shown on the left path (red), health district–level forecasts on the middle path (blue), and state-level forecasts on the right path (green). The information on the right provides additional detail on each stage in the experimental design. AR: autoregressive; ARIMA: autoregressive integrated moving average; ARMA: autoregressive moving average; HW: Holt-Winters; MA: moving average; MdAE: median absolute error; MdAPE: median absolute percentage error; VA: Virginia.
