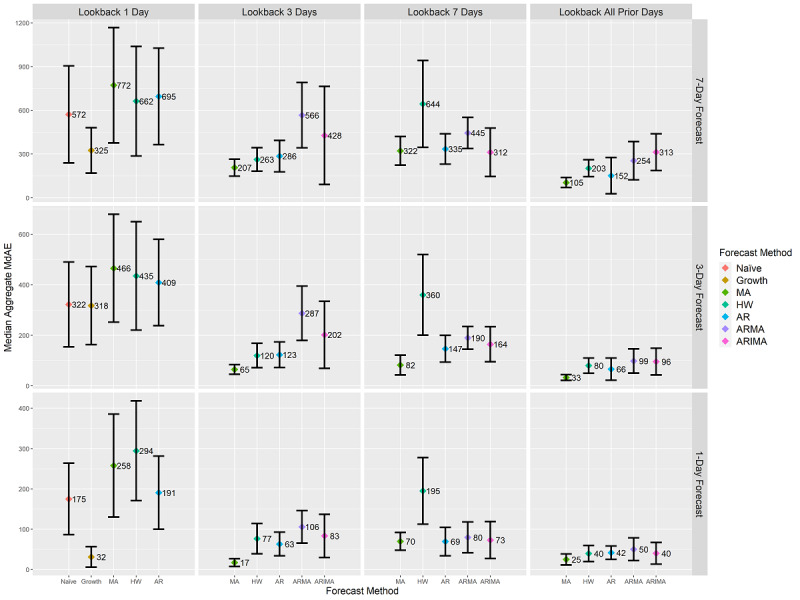
Figure 4.

State-level forecasts’ aggregated median MdAE values and 95% CI. CI ranges are calculated using box plot notch ranges around the median. Statistically significant differences at a P value of .01 are identified by nonoverlapping CI ranges of forecasting methods at each combination of forecast length and look-back length. Units are in terms of COVID-19 cumulative case counts. Y-axis scales differ on each row based on the scale of the contained data. Due to differing assumptions, five of the seven forecasting methods are present for each look-back length as indicated on the x-axis. AR: autoregressive; ARIMA: autoregressive integrated moving average; ARMA: autoregressive moving average; HW: Holt-Winters; MA: moving average; MdAE: median absolute error.
