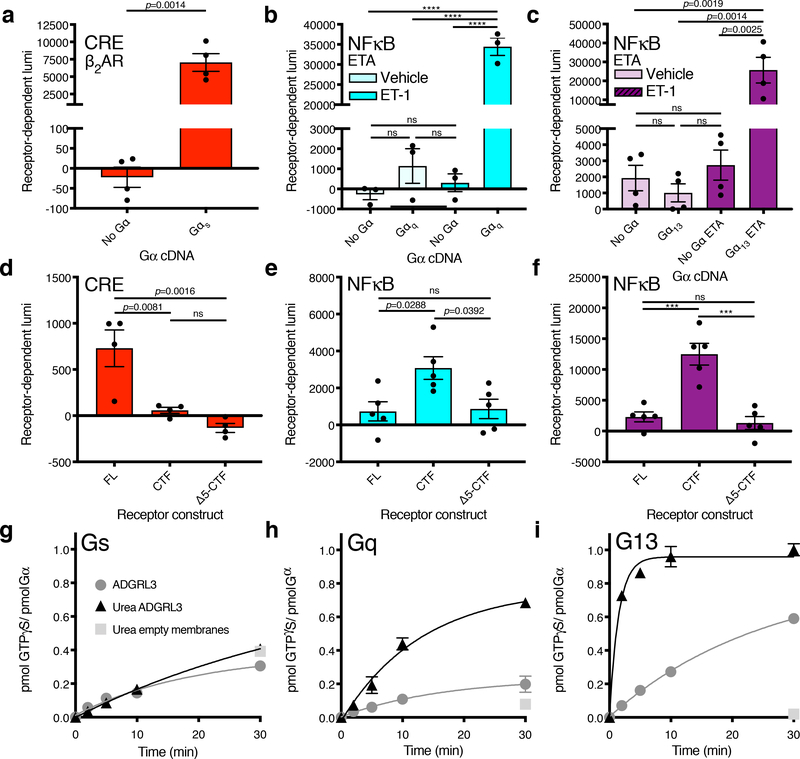
Figure 2. Adgrl3 CTF signals through Gq and G13.
Screen of Adgrl3 signaling in the major G protein signaling pathways utilizing a CRISPR knockout cell line (HEKΔ7) and a panel of gene expression assays. (a-c) Assay controls showing that the Gαs-coupled β2AR signals in CRE only when Gαs is reintroduced (a) and that ETA signals in NFκB only when Gαq (b) or Gα13 (c) is reintroduced. In (a) an unpaired two-tailed t-test was used to determine statistical significance between the No Gα and Gαs conditions; in (b,c) One-way ANOVA was employed with Tukey’s multiple-comparison post-hoc test (b, ****p<0.0001). (d-f) Gene expression signals for Adgrl3 constructs FL, CTF, and Δ5-CTF. (d) CRE with Gαs (e) NFκB with Gαq (f) NFκB with Gα13. Each Gα protein species was reintroduced at an optimized cDNA concentrations (Supplementary Fig. 5). In (d-f) One-way ANOVA with Tukey’s multiple-comparison post-hoc test was performed to determine statistical significance between the FL, CTF and Δ5-CTF conditions (ns p>0.05, ***p<0.001, ****p<0.0001). In panels (a-f) the baseline signal of empty vector was subtracted to show receptor-dependent luminescence (lumi). The full screen for Adgr3 in HEKΔ7 is shown in Extended Data Fig. 3. (g-i) ADGRL3 N-terminal dissociation induced by urea enhances G13 and Gq activation. Mock and urea-treated ADGRL3 membranes or empty High-Five membranes were reconstituted with purified Gαs (g) Gαq (h) Gα13 (i) and Gβ1Gγ2 heterodimer and receptor-stimulated [35S]-GTPγS binding kinetics were measured15,51,52. In panels (a-f) bars are presented as mean ±SEM from (a) n=4 (b-c) n=3 (d) n=4 (e-f) n=5 independent experimental replicates. In panels (g-i) data are from one representative experiment performed 3 times. Error bars mean ±SD from three technical replicates. See Supplementary Data for the full set of p-values.

